Juvenile Court Statistics 2005. - Office of Juvenile Justice and ...
Juvenile Court Statistics 2005. - Office of Juvenile Justice and ...
Juvenile Court Statistics 2005. - Office of Juvenile Justice and ...
- No tags were found...

You also want an ePaper? Increase the reach of your titles
YUMPU automatically turns print PDFs into web optimized ePapers that Google loves.
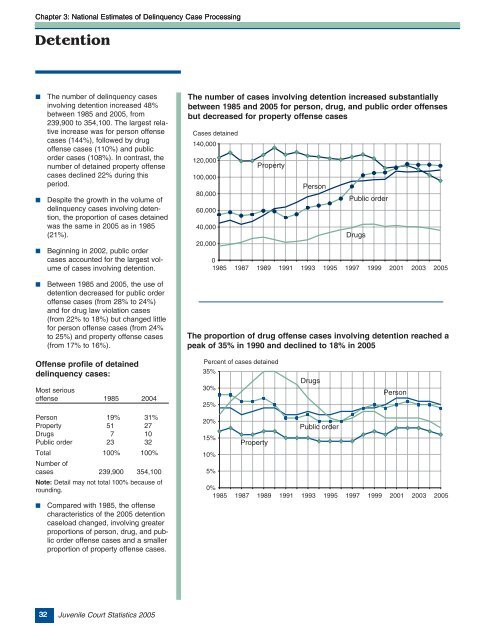
Chapter 3: National Estimates <strong>of</strong> Delinquency Case ProcessingDetention■■■■The number <strong>of</strong> delinquency casesinvolving detention increased 48%between 1985 <strong>and</strong> 2005, from239,900 to 354,100. The largest relativeincrease was for person <strong>of</strong>fensecases (144%), followed by drug<strong>of</strong>fense cases (110%) <strong>and</strong> publicorder cases (108%). In contrast, thenumber <strong>of</strong> detained property <strong>of</strong>fensecases declined 22% during thisperiod.Despite the growth in the volume <strong>of</strong>delinquency cases involving detention,the proportion <strong>of</strong> cases detainedwas the same in 2005 as in 1985(21%).Beginning in 2002, public ordercases accounted for the largest volume<strong>of</strong> cases involving detention.Between 1985 <strong>and</strong> 2005, the use <strong>of</strong>detention decreased for public order<strong>of</strong>fense cases (from 28% to 24%)<strong>and</strong> for drug law violation cases(from 22% to 18%) but changed littlefor person <strong>of</strong>fense cases (from 24%to 25%) <strong>and</strong> property <strong>of</strong>fense cases(from 17% to 16%).The number <strong>of</strong> cases involving detention increased substantiallybetween 1985 <strong>and</strong> 2005 for person, drug, <strong>and</strong> public order <strong>of</strong>fensesbut decreased for property <strong>of</strong>fense casesCases detained140,000120,000100,00080,00060,00040,00020,000PropertyPersonPublic orderDrugs01985 1987 1989 1991 1993 1995 1997 1999 2001 2003 2005The proportion <strong>of</strong> drug <strong>of</strong>fense cases involving detention reached apeak <strong>of</strong> 35% in 1990 <strong>and</strong> declined to 18% in 2005Offense pr<strong>of</strong>ile <strong>of</strong> detaineddelinquency cases:Most serious<strong>of</strong>fense 1985 2004Percent <strong>of</strong> cases detained35%30%25%DrugsPersonPerson 19% 31%Property 51 27Drugs 7 10Public order 23 32Total 100% 100%Number <strong>of</strong>cases 239,900 354,100Note: Detail may not total 100% because <strong>of</strong>rounding.■Compared with 1985, the <strong>of</strong>fensecharacteristics <strong>of</strong> the 2005 detentioncaseload changed, involving greaterproportions <strong>of</strong> person, drug, <strong>and</strong> publicorder <strong>of</strong>fense cases <strong>and</strong> a smallerproportion <strong>of</strong> property <strong>of</strong>fense cases.20%15%10%5%PropertyPublic order0%1985 1987 1989 1991 1993 1995 1997 1999 2001 2003 200532<strong>Juvenile</strong> <strong>Court</strong> <strong>Statistics</strong> 2005


![Chapter 5 [PDF] - Office of Juvenile Justice and Delinquency ...](https://img.yumpu.com/46584340/1/190x245/chapter-5-pdf-office-of-juvenile-justice-and-delinquency-.jpg?quality=85)