Juvenile Court Statistics 2005. - Office of Juvenile Justice and ...
Juvenile Court Statistics 2005. - Office of Juvenile Justice and ...
Juvenile Court Statistics 2005. - Office of Juvenile Justice and ...
- No tags were found...

You also want an ePaper? Increase the reach of your titles
YUMPU automatically turns print PDFs into web optimized ePapers that Google loves.
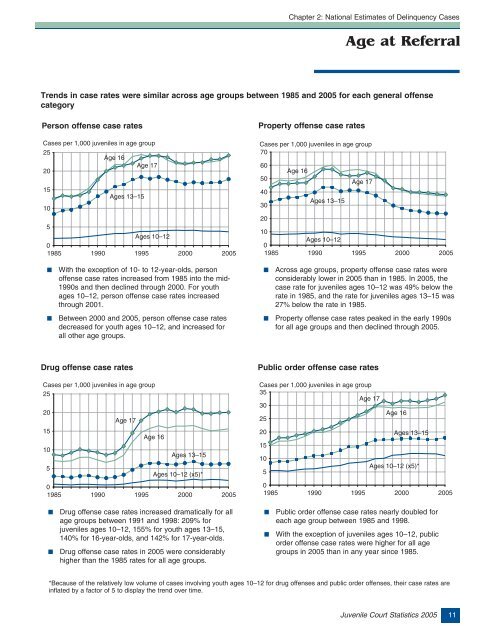
Chapter 2: National Estimates <strong>of</strong> Delinquency CasesAge at ReferralTrends in case rates were similar across age groups between 1985 <strong>and</strong> 2005 for each general <strong>of</strong>fensecategoryPerson <strong>of</strong>fense case ratesCases per 1,000 juveniles in age group25Age 16Age 172015105Ages 13–15Ages 10–1201985 1990 1995 2000 2005Property <strong>of</strong>fense case ratesCases per 1,000 juveniles in age group706050403020Age 16Ages 13–15Age 1710Ages 10–1201985 1990 1995 2000 2005■With the exception <strong>of</strong> 10- to 12-year-olds, person<strong>of</strong>fense case rates increased from 1985 into the mid-1990s <strong>and</strong> then declined through 2000. For youthages 10–12, person <strong>of</strong>fense case rates increasedthrough 2001.■Across age groups, property <strong>of</strong>fense case rates wereconsiderably lower in 2005 than in 1985. In 2005, thecase rate for juveniles ages 10–12 was 49% below therate in 1985, <strong>and</strong> the rate for juveniles ages 13–15 was27% below the rate in 1985.■Between 2000 <strong>and</strong> 2005, person <strong>of</strong>fense case ratesdecreased for youth ages 10–12, <strong>and</strong> increased forall other age groups.■Property <strong>of</strong>fense case rates peaked in the early 1990sfor all age groups <strong>and</strong> then declined through <strong>2005.</strong>Drug <strong>of</strong>fense case ratesCases per 1,000 juveniles in age group252015105Age 17Age 16Ages 13–15Ages 10–12 (x5)*01985 1990 1995 2000 2005Public order <strong>of</strong>fense case ratesCases per 1,000 juveniles in age group35Age 1730Age 162520Ages 13–151510Ages 10–12 (x5)*501985 1990 1995 2000 2005■■Drug <strong>of</strong>fense case rates increased dramatically for allage groups between 1991 <strong>and</strong> 1998: 209% forjuveniles ages 10–12, 155% for youth ages 13–15,140% for 16-year-olds, <strong>and</strong> 142% for 17-year-olds.Drug <strong>of</strong>fense case rates in 2005 were considerablyhigher than the 1985 rates for all age groups.■■Public order <strong>of</strong>fense case rates nearly doubled foreach age group between 1985 <strong>and</strong> 1998.With the exception <strong>of</strong> juveniles ages 10–12, publicorder <strong>of</strong>fense case rates were higher for all agegroups in 2005 than in any year since 1985.*Because <strong>of</strong> the relatively low volume <strong>of</strong> cases involving youth ages 10–12 for drug <strong>of</strong>fenses <strong>and</strong> public order <strong>of</strong>fenses, their case rates areinflated by a factor <strong>of</strong> 5 to display the trend over time.<strong>Juvenile</strong> <strong>Court</strong> <strong>Statistics</strong> 2005 11

![Chapter 5 [PDF] - Office of Juvenile Justice and Delinquency ...](https://img.yumpu.com/46584340/1/190x245/chapter-5-pdf-office-of-juvenile-justice-and-delinquency-.jpg?quality=85)