group financialsummaryDescription 2006 2006 2005 2004 2003 2002 2001 2000US$’000 RM’000 RM’000 RM’000 RM’000 RM’000 RM’000 RM’000Revenue 154,908 561,541 668,951 776,904 1,500,363 2,961,807 2,773,246 2,760,887Profit Before Taxation 41,166 149,226 140,577 191,392 293,938 287,936 319,832 305,714Profit After Taxation & Minority Interests 24,570 89,066 67,458 93,935 134,358 23,910 55,426 57,642Extraordinary Items - - - - - - - -Profit Attributable To Shareholders 24,570 89,066 67,458 93,935 134,358 23,910 55,426 57,642Share Capital 247,013 895,423 868,077 867,175 867,170 866,646 835,067 819,457Share Premium 15,870 57,529 934,686 934,144 934,141 934,105 915,465 903,560Reserves 241,760 876,378 1,720,202 1,605,889 1,541,374 1,620,656 1,651,991 1,637,228Shareholders’ Equity 504,643 1,829,330 3,522,965 3,407,208 3,342,685 3,421,407 3,402,523 3,360,245Minority Interests 19,862 71,998 73,643 126,260 127,235 605,710 459,580 400,660Capital Funds 524,505 1,901,328 3,596,608 3,533,468 3,469,920 4,027,117 3,862,103 3,760,905ICULS 85,616 310,359 434,538 588,659 640,993 894,458 944,049 971,345Deferred Taxation 36,983 134,064 127,213 144,248 140,878 142,590 104,244 109,291Deferred Liabilities 235,827 854,873 831,610 1,763,257 1,892,239 665,448 684,534 706,139Current Liabilities 533,759 1,934,876 1,940,400 781,040 703,316 1,150,244 1,295,231 1,359,1731,416,690 5,135,500 6,930,369 6,810,672 6,847,346 6,879,857 6,890,161 6,906,853Property, Plant And Equipment 442,196 1,602,961 1,567,876 1,616,838 1,659,817 1,800,521 1,732,283 1,714,071Intangible Assets 1,693 6,138 20,842 <strong>147</strong>,872 158,562 1,393,768 1,291,884 1,283,870Non-Current Assets 636,528 2,307,413 2,627,095 2,341,604 3,766,726 2,234,985 2,562,727 1,289,553Current Assets 336,273 1,218,988 2,714,556 2,704,358 1,262,241 1,450,583 1,303,267 2,619,359Total Assets 1,416,690 5,135,500 6,930,369 6,810,672 6,847,346 6,879,857 6,890,161 6,906,853Net Tangible Assets Per Share (US$/RM) 0.56 2.04 4.03 3.76 3.67 2.34 2.53 2.53Net Assets Per Share (US$/RM) 0.56 2.04 4.06 3.93 3.85 3.95 4.07 4.10Gross Earnings Per Share (US$/RM) 0.05 0.17 0.16 0.21 0.25 0.14 0.15 0.18Net Earnings Per Share (US$/RM) 0.03 0.10 0.08 0.11 0.16 0.03 0.07 0.08Net Earnings Including Extraordinary ItemsPer Share (US$/RM) 0.03 0.10 0.08 0.11 0.16 0.03 0.07 0.08Dividend Rate (%) 5 5 5 5 - 2.5 2.5 3.5Dividend Amount (US$’000/RM’000) 8,892 32,235 31,251 31,218 - 15,599 15,027 20,828Note:Where additional shares are issued for cash, the earnings per share is calculated on a weighted average number of shares.Exchange rate: US$1.00=RM3.625Annual Report 2006<strong>Berjaya</strong> Land <strong>Berhad</strong> (201765-A)20
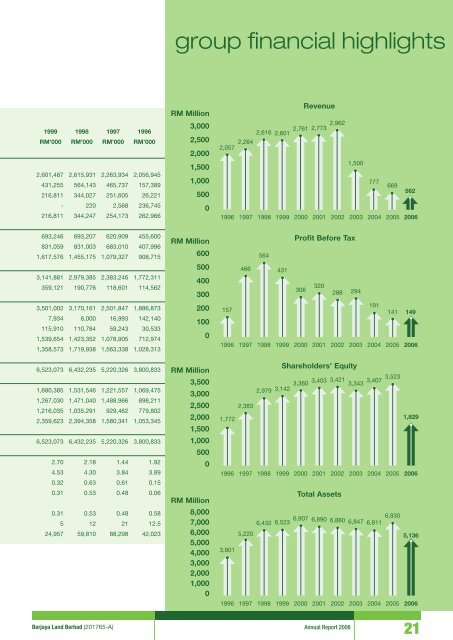
group financial highlightsRM MillionRevenue1999 1998 1997 1996RM’000 RM’000 RM’000 RM’0003,0002,5002,057 2,264 2,616 2,601 2,761 2,773 2,962 1,5002,0002,601,487 2,615,931 2,263,934 2,056,945431,255 564,143 465,737 157,389216,811 344,027 251,605 26,2211,5001,000500777669562- 220 2,568 236,745216,811 344,247 254,173 262,96601996 1997 1998 1999 2000 2001 2002 2003 2004 20052006693,246 693,207 620,909 455,600831,059 831,003 683,010 407,9961,617,576 1,455,175 1,079,327 908,7153,141,881 2,979,385 2,383,246 1,772,311359,121 190,776 118,601 114,562RM Million600500400300466564431Profit Before Tax320306288 2943,501,002 3,170,161 2,501,847 1,886,8737,934 8,000 16,993 142,140115,910 110,784 59,243 30,5331,539,654 1,423,352 1,078,905 712,9741,358,573 1,719,938 1,563,338 1,028,31320010001571911411996 1997 1998 1999 2000 2001 2002 2003 2004 200514920066,523,073 6,432,235 5,220,326 3,800,8331,680,385 1,531,546 1,221,557 1,069,4751,267,030 1,471,040 1,488,966 898,2111,216,035 1,035,291 929,462 779,8022,359,623 2,394,358 1,580,341 1,053,3456,523,073 6,432,235 5,220,326 3,800,8332.70 2.18 1.44 1.924.53 4.30 3.84 3.890.32 0.63 0.61 0.150.31 0.53 0.48 0.060.31 0.53 0.48 0.585 12 21 12.524,957 59,810 88,298 42,023RM Million3,5003,0002,5002,0001,5001,0005000RM Million8,0007,0006,0005,0004,0003,0002,0001,0000Shareholders’ Equity2,979 3,142 3,360 3,403 3,421 3,407 3,5233,3432,3831,7721,8291996 1997 1998 1999 2000 2001 2002 2003 2004 2005 2006Total Assets6,432 6,523 6,907 6,9306,890 6,880 6,847 6,8115,2205,1363,8011996 1997 1998 1999 2000 2001 2002 2003 2004 2005 2006<strong>Berjaya</strong> Land <strong>Berhad</strong> (201765-A) Annual Report 200621