Nhng tin b trong Quang hc, Quang ph và ng dng VI ISSN 1859 - 4271
Nhng tin b trong Quang hc, Quang ph và ng dng VI ISSN 1859 - 4271
Nhng tin b trong Quang hc, Quang ph và ng dng VI ISSN 1859 - 4271

You also want an ePaper? Increase the reach of your titles
YUMPU automatically turns print PDFs into web optimized ePapers that Google loves.
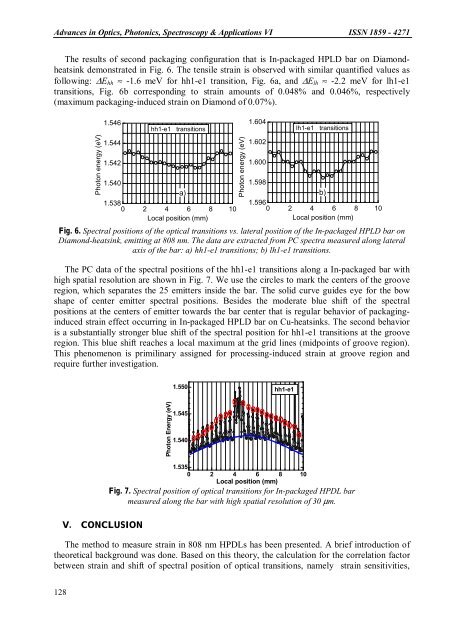
Advances in Optics, Photonics, Spectroscopy & Applications <strong>VI</strong> <strong>ISSN</strong> <strong>1859</strong> - <strong>4271</strong>The results of second packagi<strong>ng</strong> configuration that is In-packaged HPLD bar on Diamondheatsinkdemonstrated in Fig. 6. The tensile strain is observed with similar quantified values asfollowi<strong>ng</strong>: ∆E hh ≈ -1.6 meV for hh1-e1 transition, Fig. 6a, and ∆E lh ≈ -2.2 meV for lh1-e1transitions, Fig. 6b correspondi<strong>ng</strong> to strain amounts of 0.048% and 0.046%, respectively(maximum packagi<strong>ng</strong>-induced strain on Diamond of 0.07%).Photon energy (eV)1.5461.5441.542hh1-e1 transitionsPhoton energy (eV)1.6041.6021.600lh1-e1 transitions1.5401.598a) b)1.5381.5960 2 4 6 8 10 0 2 4 6 8 10Local position (mm)Local position (mm)Fig. 6. Spectral positions of the optical transitions vs. lateral position of the In-packaged HPLD bar onDiamond-heatsink, emit<s<stro<strong>ng</strong>>tro<strong>ng</strong></stro<strong>ng</strong>>>tin</s<stro<strong>ng</strong>>tro<strong>ng</strong></stro<strong>ng</strong>>>g at 808 nm. The data are extracted from PC spectra measured alo<strong>ng</strong> lateralaxis of the bar: a) hh1-e1 transitions; b) lh1-e1 transitions.The PC data of the spectral positions of the hh1-e1 transitions alo<strong>ng</strong> a In-packaged bar withhigh spatial resolution are shown in Fig. 7. We use the circles to mark the centers of the grooveregion, which separates the 25 emitters inside the bar. The solid curve guides eye for the bowshape of center emitter spectral positions. Besides the moderate blue shift of the spectralpositions at the centers of emitter towards the bar center that is regular behavior of packagi<strong>ng</strong>inducedstrain effect occurri<strong>ng</strong> in In-packaged HPLD bar on Cu-heatsinks. The second behavioris a substantially s<stro<strong>ng</strong>>tro<strong>ng</strong></stro<strong>ng</strong>>er blue shift of the spectral position for hh1-e1 transitions at the grooveregion. This blue shift reaches a local maximum at the grid lines (midpoints of groove region).This <stro<strong>ng</strong>>ph</stro<strong>ng</strong>>enomenon is primilinary assigned for processi<strong>ng</strong>-induced strain at groove region andrequire further investigation.1.550hh1-e1Photon Energy (eV)1.5451.5401.5350 2 4 6 8 10Local position (mm)Fig. 7. Spectral position of optical transitions for In-packaged HPDL barmeasured alo<strong>ng</strong> the bar with high spatial resolution of 30 µm.V. CONCLUSIONThe method to measure strain in 808 nm HPDLs has been presented. A brief introduction oftheoretical background was done. Based on this theory, the calculation for the correlation factorbetween strain and shift of spectral position of optical transitions, namely strain sensitivities,128