Nhng tin b trong Quang hc, Quang ph và ng dng VI ISSN 1859 - 4271
Nhng tin b trong Quang hc, Quang ph và ng dng VI ISSN 1859 - 4271
Nhng tin b trong Quang hc, Quang ph và ng dng VI ISSN 1859 - 4271

Create successful ePaper yourself
Turn your PDF publications into a flip-book with our unique Google optimized e-Paper software.
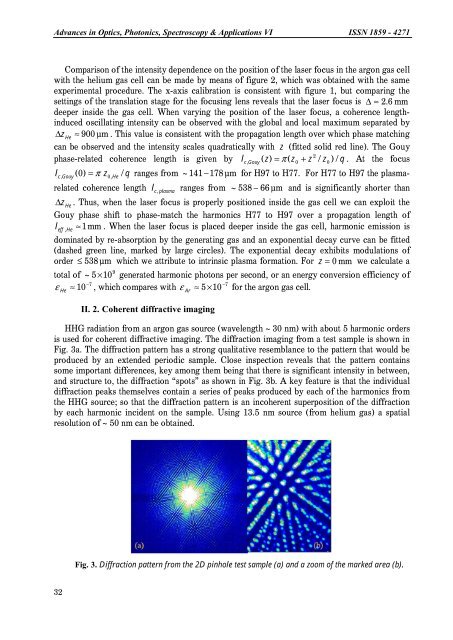
Advances in Optics, Photonics, Spectroscopy & Applications <strong>VI</strong> <strong>ISSN</strong> <strong>1859</strong> - <strong>4271</strong>Comparison of the intensity dependence on the position of the laser focus in the argon gas cellwith the helium gas cell can be made by means of figure 2, which was obtained with the sameexperimental procedure. The x-axis calibration is consistent with figure 1, but compari<strong>ng</strong> theset<s<stro<strong>ng</strong>>tro<strong>ng</strong></stro<strong>ng</strong>>>tin</s<stro<strong>ng</strong>>tro<strong>ng</strong></stro<strong>ng</strong>>>gs of the translation stage for the focusi<strong>ng</strong> lens reveals that the laser focus is ∆ ≈ 2.6 mmdeeper inside the gas cell. When varyi<strong>ng</strong> the position of the laser focus, a coherence le<strong>ng</strong>thinducedoscilla<s<stro<strong>ng</strong>>tro<strong>ng</strong></stro<strong>ng</strong>>>tin</s<stro<strong>ng</strong>>tro<strong>ng</strong></stro<strong>ng</strong>>>g intensity can be observed with the global and local maximum separated by∆zHe≈ 900 μm . This value is consistent with the propagation le<strong>ng</strong>th over which <stro<strong>ng</strong>>ph</stro<strong>ng</strong>>ase matchi<strong>ng</strong>can be observed and the intensity scales quadratically with z (fitted solid red line). The Gouy2<stro<strong>ng</strong>>ph</stro<strong>ng</strong>>ase-related coherence le<strong>ng</strong>th is given by z)= π ( z z / z ) q . At the focusl c , Gouy(0+0/lc , Gouy( 0) = π z0,He/ q ra<strong>ng</strong>es from ~ 141− 178 μm for H97 to H77. For H77 to H97 the plasmarelatedcoherence le<strong>ng</strong>th l ,ra<strong>ng</strong>es from ~ 538 − 66 μm and is significantly shorter thanc plasma∆ z He. Thus, when the laser focus is properly positioned inside the gas cell we can exploit theGouy <stro<strong>ng</strong>>ph</stro<strong>ng</strong>>ase shift to <stro<strong>ng</strong>>ph</stro<strong>ng</strong>>ase-match the harmonics H77 to H97 over a propagation le<strong>ng</strong>th ofleff , He≈1mm . When the laser focus is placed deeper inside the gas cell, harmonic emission isdominated by re-absorption by the genera<s<stro<strong>ng</strong>>tro<strong>ng</strong></stro<strong>ng</strong>>>tin</s<stro<strong>ng</strong>>tro<strong>ng</strong></stro<strong>ng</strong>>>g gas and an exponential decay curve can be fitted(dashed green line, marked by large circles). The exponential decay exhibits modulations oforder ≤ 538 μm which we attribute to intrinsic plasma formation. For z = 0 mm we calculate a9total of ~ 5× 10 generated harmonic <stro<strong>ng</strong>>ph</stro<strong>ng</strong>>otons per second, or an energy conversion efficiency ofε ≈ 10 −7−7, which compares with ε ≈ 5×10 for the argon gas cell.HeII. 2. Coherent diffractive imagi<strong>ng</strong>ArHHG radiation from an argon gas source (wavele<strong>ng</strong>th ~ 30 nm) with about 5 harmonic ordersis used for coherent diffractive imagi<strong>ng</strong>. The diffraction imagi<strong>ng</strong> from a test sample is shown inFig. 3a. The diffraction pattern has a s<stro<strong>ng</strong>>tro<strong>ng</strong></stro<strong>ng</strong>> qualitative resemblance to the pattern that would beproduced by an extended periodic sample. Close inspection reveals that the pattern containssome important differences, key amo<strong>ng</strong> them bei<strong>ng</strong> that there is significant intensity in between,and structure to, the diffraction “spots” as shown in Fig. 3b. A key feature is that the individualdiffraction peaks themselves contain a series of peaks produced by each of the harmonics fromthe HHG source; so that the diffraction pattern is an incoherent superposition of the diffractionby each harmonic incident on the sample. Usi<strong>ng</strong> 13.5 nm source (from helium gas) a spatialresolution of ~ 50 nm can be obtained.Fig. 3. Diffraction pattern from the 2D pinhole test sample (a) and a zoom of the marked area (b).32