Nhng tin b trong Quang hc, Quang ph và ng dng VI ISSN 1859 - 4271
Nhng tin b trong Quang hc, Quang ph và ng dng VI ISSN 1859 - 4271
Nhng tin b trong Quang hc, Quang ph và ng dng VI ISSN 1859 - 4271

Create successful ePaper yourself
Turn your PDF publications into a flip-book with our unique Google optimized e-Paper software.
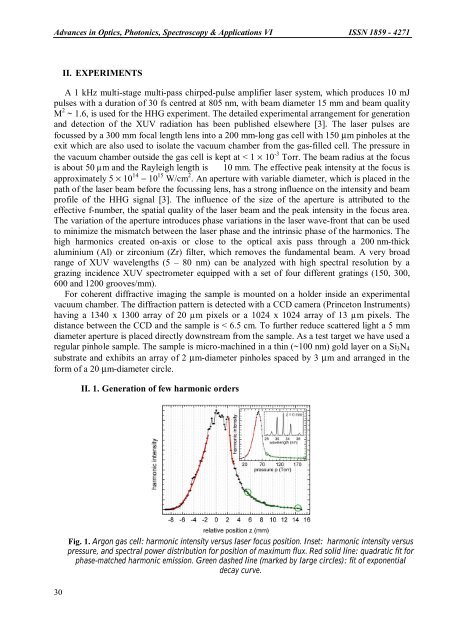
Advances in Optics, Photonics, Spectroscopy & Applications <strong>VI</strong> <strong>ISSN</strong> <strong>1859</strong> - <strong>4271</strong>II. EXPERIMENTSA 1 kHz multi-stage multi-pass chirped-pulse amplifier laser system, which produces 10 mJpulses with a duration of 30 fs centred at 805 nm, with beam diameter 15 mm and beam qualityM 2 ~ 1.6, is used for the HHG experiment. The detailed experimental arra<strong>ng</strong>ement for generationand detection of the XUV radiation has been published elsewhere [3]. The laser pulses arefocussed by a 300 mm focal le<strong>ng</strong>th lens into a 200 mm-lo<strong>ng</strong> gas cell with 150 µm pinholes at theexit which are also used to isolate the vacuum chamber from the gas-filled cell. The pressure inthe vacuum chamber outside the gas cell is kept at < 1 × 10 -3 Torr. The beam radius at the focusis about 50 µm and the Rayleigh le<strong>ng</strong>th is 10 mm. The effective peak intensity at the focus isapproximately 5 × 10 14 − 10 15 W/cm 2 . An aperture with variable diameter, which is placed in thepath of the laser beam before the focussi<strong>ng</strong> lens, has a s<stro<strong>ng</strong>>tro<strong>ng</strong></stro<strong>ng</strong>> influence on the intensity and beamprofile of the HHG signal [3]. The influence of the size of the aperture is attributed to theeffective f-number, the spatial quality of the laser beam and the peak intensity in the focus area.The variation of the aperture introduces <stro<strong>ng</strong>>ph</stro<strong>ng</strong>>ase variations in the laser wave-front that can be usedto minimize the mismatch between the laser <stro<strong>ng</strong>>ph</stro<strong>ng</strong>>ase and the intrinsic <stro<strong>ng</strong>>ph</stro<strong>ng</strong>>ase of the harmonics. Thehigh harmonics created on-axis or close to the optical axis pass through a 200 nm-thickaluminium (Al) or zirconium (Zr) filter, which removes the fundamental beam. A very broadra<strong>ng</strong>e of XUV wavele<strong>ng</strong>ths (5 – 80 nm) can be analyzed with high spectral resolution by agrazi<strong>ng</strong> incidence XUV spectrometer equipped with a set of four different gra<s<stro<strong>ng</strong>>tro<strong>ng</strong></stro<strong>ng</strong>>>tin</s<stro<strong>ng</strong>>tro<strong>ng</strong></stro<strong>ng</strong>>>gs (150, 300,600 and 1200 grooves/mm).For coherent diffractive imagi<strong>ng</strong> the sample is mounted on a holder inside an experimentalvacuum chamber. The diffraction pattern is detected with a CCD camera (Princeton Instruments)havi<strong>ng</strong> a 1340 x 1300 array of 20 µm pixels or a 1024 x 1024 array of 13 µm pixels. Thedistance between the CCD and the sample is < 6.5 cm. To further reduce scattered light a 5 mmdiameter aperture is placed directly downstream from the sample. As a test target we have used aregular pinhole sample. The sample is micro-machined in a thin (~100 nm) gold layer on a Si 3 N 4substrate and exhibits an array of 2 µm-diameter pinholes spaced by 3 µm and arra<strong>ng</strong>ed in theform of a 20 µm-diameter circle.II. 1. Generation of few harmonic orders30Fig. 1. Argon gas cell: harmonic intensity versus laser focus position. Inset: harmonic intensity versuspressure, and spectral power distribution for position of maximum flux. Red solid line: quadratic fit for<stro<strong>ng</strong>>ph</stro<strong>ng</strong>>ase-matched harmonic emission. Green dashed line (marked by large circles): fit of exponentialdecay curve.