Advances in Optics, Photonics, Spectroscopy & Applications <strong>VI</strong> <strong>ISSN</strong> <strong>1859</strong> - <strong>4271</strong>MULTIWAVELENGTH LIDAR MEASUREMENTS OF ATMOSPHERICAEROSOLS IN HANOI, <strong>VI</strong>ETNAMDinh Van Tru<strong>ng</strong>, Nguyen Thanh Binh, Dao Duy Tha<strong>ng</strong>, Nguyen Dinh Hoa<strong>ng</strong>Phu<strong>ng</strong> Viet Tiep, Nguyen Dai Hu<strong>ng</strong>Center for Quantum Electronics, Institute of Physics, Vietnam Academy of Science and Technology10 DaoTan, ThuLe, BaDinh, Hanoi, VietnamAbstract. We have made use of our newly developed multiwavele<strong>ng</strong>th LIDAR system to study theproperties of aerosols in the atmos<stro<strong>ng</strong>>ph</stro<strong>ng</strong>>ere above Hanoi, Vietnam. Our LIDAR consists of a pulsedNd:YAG laser worki<strong>ng</strong> at the fundamental (1064 nm) and the second harmonic (532 nm), and aCassegrain telescope havi<strong>ng</strong> a diameter of 20 cm to collect the backscattered light. The collectedscattered light is detected by our modular detection module which can be configured to simultaneouslythe LIDAR signal at 1064 nm and 532 nm or the Raman signal from Nitrogen molecules at 607 nm ineither analog or <stro<strong>ng</strong>>ph</stro<strong>ng</strong>>oton coun<s<stro<strong>ng</strong>>tro<strong>ng</strong></stro<strong>ng</strong>>>tin</s<stro<strong>ng</strong>>tro<strong>ng</strong></stro<strong>ng</strong>>>g mode, allowi<strong>ng</strong> our LIDAR system to cover large ra<strong>ng</strong>e, from about500 nm up to 30 km. We conducted LIDAR measurements over a period of several months to studythe vertical distribution and time evolution of atmos<stro<strong>ng</strong>>ph</stro<strong>ng</strong>>eric aerosols. Our results show that the aerosolsare mostly concentrated below 3 km. High altitude (cirrus) clouds located between 10 to 15 km havebeen detected over Hanoi.I. INTRODUCTIONLIDAR light detection and ra<strong>ng</strong>i<strong>ng</strong> is a powerful and commonly used technique to remotelyprofile the atmos<stro<strong>ng</strong>>ph</stro<strong>ng</strong>>ere with high spatial and temporal resolution as well as estima<s<stro<strong>ng</strong>>tro<strong>ng</strong></stro<strong>ng</strong>>>tin</s<stro<strong>ng</strong>>tro<strong>ng</strong></stro<strong>ng</strong>>>g the<stro<strong>ng</strong>>ph</stro<strong>ng</strong>>ysical properties of atmos<stro<strong>ng</strong>>ph</stro<strong>ng</strong>>eric constituents such as aerosols or gaseous components [1,2].The variety of interaction processes of the laser radiation with the atmos<stro<strong>ng</strong>>ph</stro<strong>ng</strong>>eric constituents thatcan be used in lidar allow the determination of basic atmos<stro<strong>ng</strong>>ph</stro<strong>ng</strong>>eric properties such as temperature,humidity etc ... as well as the measurements of trace gases, aerosols and clouds.Atmos<stro<strong>ng</strong>>ph</stro<strong>ng</strong>>eric aerosols play an important role in many atmos<stro<strong>ng</strong>>ph</stro<strong>ng</strong>>eric processes. Although only aminor constituent of the atmos<stro<strong>ng</strong>>ph</stro<strong>ng</strong>>ere, they have appreciable influence on the Earth’s radiationbudget, air quality and visibility, clouds, precipitation and chemical processes in the tropos<stro<strong>ng</strong>>ph</stro<strong>ng</strong>>ereand stratos<stro<strong>ng</strong>>ph</stro<strong>ng</strong>>ere [1,3]. The dust can affect cloud properties by ac<s<stro<strong>ng</strong>>tro<strong>ng</strong></stro<strong>ng</strong>>>tin</s<stro<strong>ng</strong>>tro<strong>ng</strong></stro<strong>ng</strong>>>g as cloud condensationnuclei and ice nuclei. Thus the information on the <stro<strong>ng</strong>>ph</stro<strong>ng</strong>>ysical and optical properties of the aerosolssuch as mean particle size, particle shape, volume ex<s<stro<strong>ng</strong>>tro<strong>ng</strong></stro<strong>ng</strong>>>tin</s<stro<strong>ng</strong>>tro<strong>ng</strong></stro<strong>ng</strong>>>ction coefficients are of great interest.Rou<s<stro<strong>ng</strong>>tro<strong>ng</strong></stro<strong>ng</strong>>>tin</s<stro<strong>ng</strong>>tro<strong>ng</strong></stro<strong>ng</strong>>>e lo<strong>ng</strong>-term and vertically resolved measurements currently can only be carried out usi<strong>ng</strong>LIDAR technique. Raman technique can also be used to infer the properties of aerosols, namelythe ex<s<stro<strong>ng</strong>>tro<strong>ng</strong></stro<strong>ng</strong>>>tin</s<stro<strong>ng</strong>>tro<strong>ng</strong></stro<strong>ng</strong>>>ction coefficient and the LIDAR constant.Over the last couple of years at the Institute of Physics we have carried out the developmentof a lidar system to profile the atmos<stro<strong>ng</strong>>ph</stro<strong>ng</strong>>ere and study the spatial/temporal distribution and<stro<strong>ng</strong>>ph</stro<strong>ng</strong>>ysical properties of aerosols.II. DESCRIPTION OF THE LIDAR SYSTEMWe use a Nd:YAG laser (Quantel Brilliant model) emit<s<stro<strong>ng</strong>>tro<strong>ng</strong></stro<strong>ng</strong>>>tin</s<stro<strong>ng</strong>>tro<strong>ng</strong></stro<strong>ng</strong>>>g 360 mJ at 1064 nm and 180 mJ atthe second harmonic 532 nm as the transmitter of our LIDAR system. The laser beams at thesetwo wavele<strong>ng</strong>ths are directed into the atmos<stro<strong>ng</strong>>ph</stro<strong>ng</strong>>ere by a pair of high energy laser mirrors M1 and144
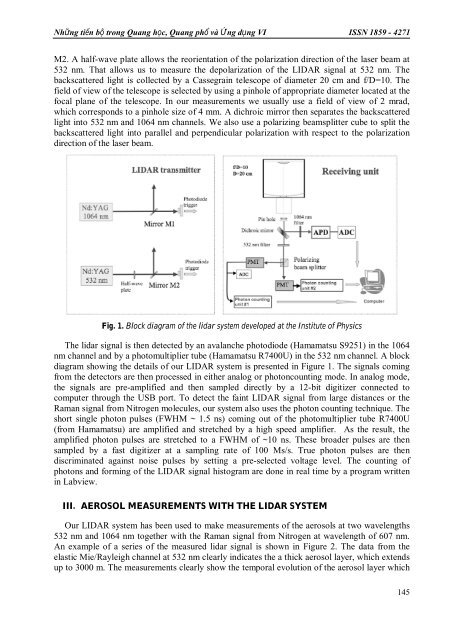
Nhữ<strong>ng</strong> tiến bộ <stro<strong>ng</strong>>tro<strong>ng</strong></stro<strong>ng</strong>> <stro<strong>ng</strong>>Qua<strong>ng</strong></stro<strong>ng</strong>> học, <stro<strong>ng</strong>>Qua<strong>ng</strong></stro<strong>ng</strong>> <stro<strong>ng</strong>>ph</stro<strong>ng</strong>>ổ và Ứ<strong>ng</strong> dụ<strong>ng</strong> <strong>VI</strong> <strong>ISSN</strong> <strong>1859</strong> - <strong>4271</strong>M2. A half-wave plate allows the reorientation of the polarization direction of the laser beam at532 nm. That allows us to measure the depolarization of the LIDAR signal at 532 nm. Thebackscattered light is collected by a Cassegrain telescope of diameter 20 cm and f/D=10. Thefield of view of the telescope is selected by usi<strong>ng</strong> a pinhole of appropriate diameter located at thefocal plane of the telescope. In our measurements we usually use a field of view of 2 mrad,which corresponds to a pinhole size of 4 mm. A dichroic mirror then separates the backscatteredlight into 532 nm and 1064 nm channels. We also use a polarizi<strong>ng</strong> beamsplitter cube to split thebackscattered light into parallel and perpendicular polarization with respect to the polarizationdirection of the laser beam.Fig. 1. Block diagram of the lidar system developed at the Institute of PhysicsThe lidar signal is then detected by an avalanche <stro<strong>ng</strong>>ph</stro<strong>ng</strong>>otodiode (Hamamatsu S9251) in the 1064nm channel and by a <stro<strong>ng</strong>>ph</stro<strong>ng</strong>>otomultiplier tube (Hamamatsu R7400U) in the 532 nm channel. A blockdiagram showi<strong>ng</strong> the details of our LIDAR system is presented in Figure 1. The signals comi<strong>ng</strong>from the detectors are then processed in either analog or <stro<strong>ng</strong>>ph</stro<strong>ng</strong>>otoncoun<s<stro<strong>ng</strong>>tro<strong>ng</strong></stro<strong>ng</strong>>>tin</s<stro<strong>ng</strong>>tro<strong>ng</strong></stro<strong>ng</strong>>>g mode. In analog mode,the signals are pre-amplified and then sampled directly by a 12-bit digitizer connected tocomputer through the USB port. To detect the faint LIDAR signal from large distances or theRaman signal from Nitrogen molecules, our system also uses the <stro<strong>ng</strong>>ph</stro<strong>ng</strong>>oton coun<s<stro<strong>ng</strong>>tro<strong>ng</strong></stro<strong>ng</strong>>>tin</s<stro<strong>ng</strong>>tro<strong>ng</strong></stro<strong>ng</strong>>>g technique. Theshort si<strong>ng</strong>le <stro<strong>ng</strong>>ph</stro<strong>ng</strong>>oton pulses (FWHM ~ 1.5 ns) comi<strong>ng</strong> out of the <stro<strong>ng</strong>>ph</stro<strong>ng</strong>>otomultiplier tube R7400U(from Hamamatsu) are amplified and stretched by a high speed amplifier. As the result, theamplified <stro<strong>ng</strong>>ph</stro<strong>ng</strong>>oton pulses are stretched to a FWHM of ~10 ns. These broader pulses are thensampled by a fast digitizer at a sampli<strong>ng</strong> rate of 100 Ms/s. True <stro<strong>ng</strong>>ph</stro<strong>ng</strong>>oton pulses are thendiscriminated against noise pulses by set<s<stro<strong>ng</strong>>tro<strong>ng</strong></stro<strong>ng</strong>>>tin</s<stro<strong>ng</strong>>tro<strong>ng</strong></stro<strong>ng</strong>>>g a pre-selected voltage level. The coun<s<stro<strong>ng</strong>>tro<strong>ng</strong></stro<strong>ng</strong>>>tin</s<stro<strong>ng</strong>>tro<strong>ng</strong></stro<strong>ng</strong>>>g of<stro<strong>ng</strong>>ph</stro<strong>ng</strong>>otons and formi<strong>ng</strong> of the LIDAR signal histogram are done in real time by a program writtenin Labview.III. AEROSOL MEASUREMENTS WITH THE LIDAR SYSTEMOur LIDAR system has been used to make measurements of the aerosols at two wavele<strong>ng</strong>ths532 nm and 1064 nm together with the Raman signal from Nitrogen at wavele<strong>ng</strong>th of 607 nm.An example of a series of the measured lidar signal is shown in Figure 2. The data from theelastic Mie/Rayleigh channel at 532 nm clearly indicates the a thick aerosol layer, which extendsup to 3000 m. The measurements clearly show the temporal evolution of the aerosol layer which145
- Page 2 and 3:
Advances in Optics, Photonics, Spec
- Page 4 and 5:
Advances in Optics, Photonics, Spec
- Page 7 and 8:
Những tiến bộ trong</
- Page 9 and 10:
Những tiến bộ trong</
- Page 11 and 12:
Những tiến bộ trong</
- Page 13 and 14:
Những tiến bộ trong</
- Page 15 and 16:
Những tiến bộ trong</
- Page 17 and 18:
Những tiến bộ trong</
- Page 19 and 20:
Những tiến bộ trong</
- Page 21 and 22:
Những tiến bộ trong</
- Page 23 and 24:
Những tiến bộ trong</
- Page 25 and 26:
Những tiến bộ trong</
- Page 27 and 28:
Những tiến bộ trong</
- Page 29 and 30:
Những tiến bộ trong</
- Page 31 and 32:
Những tiến bộ trong</
- Page 33 and 34:
Những tiến bộ trong</
- Page 35 and 36:
Những tiến bộ trong</
- Page 37 and 38:
Những tiến bộ trong</
- Page 39 and 40:
Những tiến bộ trong</
- Page 41 and 42:
Những tiến bộ trong</
- Page 43 and 44:
Những tiến bộ trong</
- Page 45 and 46:
Những tiến bộ trong</
- Page 47 and 48:
Những tiến bộ trong</
- Page 49 and 50:
Những tiến bộ trong</
- Page 51 and 52:
Những tiến bộ trong</
- Page 53 and 54:
Những tiến bộ trong</
- Page 55 and 56:
Những tiến bộ trong</
- Page 57 and 58:
Những tiến bộ trong</
- Page 59 and 60:
Những tiến bộ trong</
- Page 61 and 62:
Những tiến bộ trong</
- Page 63 and 64:
Những tiến bộ trong</
- Page 65 and 66:
Những tiến bộ trong</
- Page 67 and 68:
Những tiến bộ trong</
- Page 69 and 70:
Những tiến bộ trong</
- Page 71 and 72:
Những tiến bộ trong</
- Page 73 and 74:
Những tiến bộ trong</
- Page 75 and 76:
Những tiến bộ trong</
- Page 77 and 78:
Những tiến bộ trong</
- Page 79 and 80:
Những tiến bộ trong</
- Page 81 and 82:
Những tiến bộ trong</
- Page 83 and 84:
Những tiến bộ trong</
- Page 85 and 86:
Những tiến bộ trong</
- Page 87 and 88:
Những tiến bộ trong</
- Page 89 and 90:
Những tiến bộ trong</
- Page 91 and 92:
Những tiến bộ trong</
- Page 93 and 94:
Những tiến bộ trong</
- Page 95 and 96:
Những tiến bộ trong</
- Page 97 and 98:
Những tiến bộ trong</
- Page 99 and 100:
Những tiến bộ trong</
- Page 101 and 102:
Những tiến bộ trong</
- Page 103 and 104:
Những tiến bộ trong</
- Page 105 and 106: Những tiến bộ trong</
- Page 107 and 108: Những tiến bộ trong</
- Page 109 and 110: Những tiến bộ trong</
- Page 111 and 112: Những tiến bộ trong</
- Page 113 and 114: Những tiến bộ trong</
- Page 115 and 116: Những tiến bộ trong</
- Page 117 and 118: Những tiến bộ trong</
- Page 119 and 120: Những tiến bộ trong</
- Page 121 and 122: Những tiến bộ trong</
- Page 123 and 124: Những tiến bộ trong</
- Page 125 and 126: Những tiến bộ trong</
- Page 127 and 128: Những tiến bộ trong</
- Page 129 and 130: Những tiến bộ trong</
- Page 131 and 132: Những tiến bộ trong</
- Page 133 and 134: Những tiến bộ trong</
- Page 135 and 136: Những tiến bộ trong</
- Page 137 and 138: Những tiến bộ trong</
- Page 139 and 140: Những tiến bộ trong</
- Page 141 and 142: Những tiến bộ trong</
- Page 143 and 144: Những tiến bộ trong</
- Page 145 and 146: Những tiến bộ trong</
- Page 147 and 148: Những tiến bộ trong</
- Page 149 and 150: Những tiến bộ trong</
- Page 151 and 152: Những tiến bộ trong</
- Page 153 and 154: Những tiến bộ trong</
- Page 155: Những tiến bộ trong</
- Page 159: Những tiến bộ trong</