Feasibility of Fish Passage at Alameda Creek Diversion Dam
Feasibility of Fish Passage at Alameda Creek Diversion Dam
Feasibility of Fish Passage at Alameda Creek Diversion Dam

You also want an ePaper? Increase the reach of your titles
YUMPU automatically turns print PDFs into web optimized ePapers that Google loves.
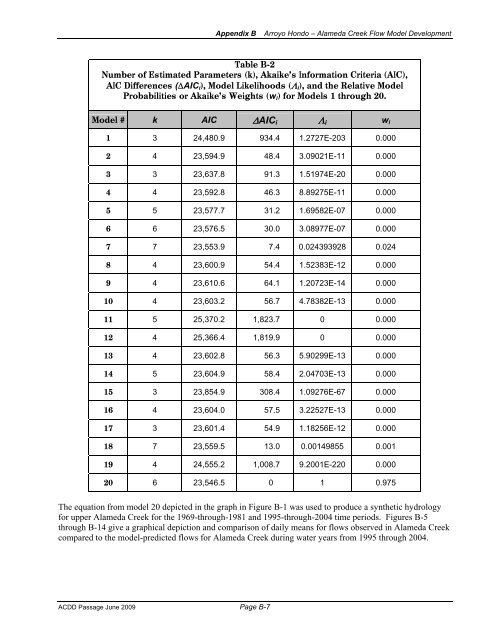
Appendix BArroyo Hondo – <strong>Alameda</strong> <strong>Creek</strong> Flow Model DevelopmentTable B-2Number <strong>of</strong> Estim<strong>at</strong>ed Parameters (k), Akaike’s Inform<strong>at</strong>ion Criteria (AIC),AIC Differences (ΔAIC i ), Model Likelihoods (Λ i ), and the Rel<strong>at</strong>ive ModelProbabilities or Akaike’s Weights (w i ) for Models 1 through 20.Model # k AIC ΔAIC i Λ i w i1 3 24,480.9 934.4 1.2727E-203 0.0002 4 23,594.9 48.4 3.09021E-11 0.0003 3 23,637.8 91.3 1.51974E-20 0.0004 4 23,592.8 46.3 8.89275E-11 0.0005 5 23,577.7 31.2 1.69582E-07 0.0006 6 23,576.5 30.0 3.08977E-07 0.0007 7 23,553.9 7.4 0.024393928 0.0248 4 23,600.9 54.4 1.52383E-12 0.0009 4 23,610.6 64.1 1.20723E-14 0.00010 4 23,603.2 56.7 4.78382E-13 0.00011 5 25,370.2 1,823.7 0 0.00012 4 25,366.4 1,819.9 0 0.00013 4 23,602.8 56.3 5.90299E-13 0.00014 5 23,604.9 58.4 2.04703E-13 0.00015 3 23,854.9 308.4 1.09276E-67 0.00016 4 23,604.0 57.5 3.22527E-13 0.00017 3 23,601.4 54.9 1.18256E-12 0.00018 7 23,559.5 13.0 0.00149855 0.00119 4 24,555.2 1,008.7 9.2001E-220 0.00020 6 23,546.5 0 1 0.975The equ<strong>at</strong>ion from model 20 depicted in the graph in Figure B-1 was used to produce a synthetic hydrologyfor upper <strong>Alameda</strong> <strong>Creek</strong> for the 1969-through-1981 and 1995-through-2004 time periods. Figures B-5through B-14 give a graphical depiction and comparison <strong>of</strong> daily means for flows observed in <strong>Alameda</strong> <strong>Creek</strong>compared to the model-predicted flows for <strong>Alameda</strong> <strong>Creek</strong> during w<strong>at</strong>er years from 1995 through 2004.ACDD <strong>Passage</strong> June 2009 Page B-7