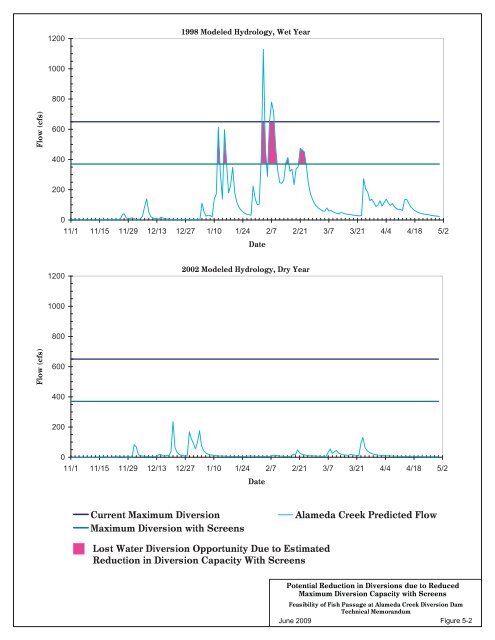
<strong>Feasibility</strong> <strong>of</strong> <strong>Fish</strong> <strong>Passage</strong> <strong>at</strong> <strong>Alameda</strong> <strong>Creek</strong> <strong>Diversion</strong> <strong>Dam</strong>■■Screened <strong>Diversion</strong> with Schedule B Bypass Flows represents the estim<strong>at</strong>ed amount <strong>of</strong> w<strong>at</strong>er th<strong>at</strong>could have been diverted under simul<strong>at</strong>ed flows if bypass flows consistent with the SFPUCproposednormal w<strong>at</strong>er year instream flow schedule were bypassed downstream <strong>at</strong> ACDD, whileother flows up to 370 cfs were diverted during the November-through-April time period.Lost W<strong>at</strong>er <strong>Diversion</strong> Opportunity due to Screening compares the two different diversionscenarios (i.e., unscreened and screened) and quantifies the volume <strong>of</strong> w<strong>at</strong>er th<strong>at</strong> wouldpotentially not be diverted after screen implement<strong>at</strong>ion. Consistent with the order-<strong>of</strong>-magnitudecost estim<strong>at</strong>ing in this conceptual feasibility study, the SFPUC-proposed “normal w<strong>at</strong>er year”instream flow schedule (Schedule B) was used in this diversion comparison scenario.The estim<strong>at</strong>es depicted in Table 5-2 indic<strong>at</strong>e th<strong>at</strong> on average, use <strong>of</strong> screens results in an annualdiversion reduction <strong>of</strong> approxim<strong>at</strong>ely 1,510 acre-feet <strong>of</strong> w<strong>at</strong>er th<strong>at</strong> could have been diverted in anunscreened diversion condition. Annual reductions in diversion for both a wet and a dry w<strong>at</strong>er year areillustr<strong>at</strong>ed in Figure 5-2. For the purposes <strong>of</strong> this analysis, the average annual diversion reduction <strong>of</strong>approxim<strong>at</strong>ely 1,510 acre-feet <strong>of</strong> w<strong>at</strong>er was used to estim<strong>at</strong>e the annual diversion reduction due toscreening facility oper<strong>at</strong>ion. An estim<strong>at</strong>ed 2016 w<strong>at</strong>er r<strong>at</strong>e <strong>of</strong> $1,500 per acre-foot 11 was used in thisanalysis because it accounts for the time differential <strong>of</strong> up to several years between this estim<strong>at</strong>e and theactual construction and oper<strong>at</strong>ion <strong>of</strong> a potential fish ladder. Therefore, the annual lost diversionopportunity cost due to reduced diversion capacity with screening is approxim<strong>at</strong>ely $2,265,000. Thisw<strong>at</strong>er cost is added to the annualized screen component cost in Section 5.3.5.2.2 FISH SCREEN BYPASS FLOWS<strong>Fish</strong> screening would require bypass flows <strong>at</strong> the downstream end <strong>of</strong> the screens, to maintain sweepingvelocity and prevent fish and small debris from being impinged on the screens, and to provide safedownstream passage for fish (NMFS, 2008a). The volume <strong>of</strong> w<strong>at</strong>er available for diversion toCalaveras Reservoir would be reduced due to this requirement.For purposes <strong>of</strong> cost estim<strong>at</strong>ion it is assumed th<strong>at</strong> the fish screen bypass would require 5 cfs <strong>of</strong> flow,whenever flows sufficient are available, during the entire diversion period. The estim<strong>at</strong>ed annual w<strong>at</strong>ercost calcul<strong>at</strong>ion (Section 5.2) assumes th<strong>at</strong> the SFPUC-proposed normal w<strong>at</strong>er year instream flowschedule bypass flows (Section 2.3.2.2) will be used to oper<strong>at</strong>e the fish screen bypass when they areavailable. Because the SFPUC-proposed flows (dry, normal, and wet years) would always be sufficientfor oper<strong>at</strong>ion <strong>of</strong> a fish screen bypass (5 cfs minimum), it is assumed th<strong>at</strong> there is no additional annualw<strong>at</strong>er cost associ<strong>at</strong>ed with the oper<strong>at</strong>ion <strong>of</strong> the fish screen bypass alone. The entire w<strong>at</strong>er costassoci<strong>at</strong>ed with screening is due to the potential reduction in the maximum r<strong>at</strong>e <strong>of</strong> diversion withscreening, as described in Section 5.2.1.5.2.3 FISH LADDER OPERATION FLOWSOper<strong>at</strong>ion <strong>of</strong> a fish ladder <strong>at</strong> ACDD would require a prescribed set <strong>of</strong> minimum flows, whenavailable, to be maintained prior to any w<strong>at</strong>er diversion during certain months <strong>of</strong> the year when theladder would be in oper<strong>at</strong>ion, December through April (Table 4-1). Therefore, the volume <strong>of</strong> w<strong>at</strong>eravailable for diversion to Calaveras Reservoir would also likely be reduced if a fishway wasimplemented. The degree to which SFPUC-proposed instream flows (Section 2.3.2.2) would besufficient to oper<strong>at</strong>e a fishway, and the cost <strong>of</strong> the w<strong>at</strong>er in excess <strong>of</strong> the proposed flows th<strong>at</strong> wouldbe required for th<strong>at</strong> purpose is addressed in this section.11Cost <strong>of</strong> w<strong>at</strong>er cited may be a minimum cost <strong>of</strong> replacement w<strong>at</strong>er (w<strong>at</strong>er lost from storage) as it will depend on whereand how SFPUC is able to replace the w<strong>at</strong>er. For example, recycled w<strong>at</strong>er development in San Francisco is estim<strong>at</strong>edto cost approxim<strong>at</strong>ely $3,900 per acre-foot. Thus, the actual cost <strong>of</strong> replacement w<strong>at</strong>er will depend on replacementsources available <strong>at</strong> the time replacement w<strong>at</strong>er is needed.ACDD <strong>Passage</strong> June 2009 Page 5-6
12001998 Modeled Hydrology, Wet Year1000800Flow (cfs)600400200011/1 11/15 11/29 12/13 12/27 1/10 1/24 2/7 2/21 3/7 3/21 4/4 4/18 5/2D<strong>at</strong>e12002002 Modeled Hydrology, Dry Year1000800Flow (cfs)600400200011/1 11/15 11/29 12/13 12/27 1/10 1/24 2/7 2/21 3/7 3/21 4/4 4/18 5/2D<strong>at</strong>eCurrent Maximum <strong>Diversion</strong>Maximum <strong>Diversion</strong> with Screens<strong>Alameda</strong> <strong>Creek</strong> Predicted FlowLost W<strong>at</strong>er <strong>Diversion</strong> Opportunity Due to Estim<strong>at</strong>edReduction in <strong>Diversion</strong> Capacity With ScreensPotential Reduction in <strong>Diversion</strong>s due to ReducedMaximum <strong>Diversion</strong> Capacity with Screens<strong>Feasibility</strong> <strong>of</strong> <strong>Fish</strong> <strong>Passage</strong> <strong>at</strong> <strong>Alameda</strong> <strong>Creek</strong> <strong>Diversion</strong> <strong>Dam</strong>Technical MemorandumJune 2009 Figure 5-2