<strong>Feasibility</strong> <strong>of</strong> <strong>Fish</strong> <strong>Passage</strong> <strong>at</strong> <strong>Alameda</strong> <strong>Creek</strong> <strong>Diversion</strong> <strong>Dam</strong>likely suggest th<strong>at</strong> less w<strong>at</strong>er is diverted annually through the ACDT than estim<strong>at</strong>ed in thisanalysis (Table 5-2, third column). A preliminary analysis suggests th<strong>at</strong> during the wettestmonths <strong>of</strong> a wet year the use <strong>of</strong> daily average d<strong>at</strong>a may overestim<strong>at</strong>e diversion r<strong>at</strong>es byapproxim<strong>at</strong>ely 6 percent, compared to estim<strong>at</strong>es based on 15-minute interval d<strong>at</strong>a. During mostflow conditions (dry, low, normal) there would be no difference in the diversion r<strong>at</strong>e estim<strong>at</strong>edusing daily average d<strong>at</strong>a or 15-minute interval d<strong>at</strong>a, so the actual margin <strong>of</strong> error due to the use <strong>of</strong>daily average d<strong>at</strong>a is expected to be less than 6 percent.■■■■■Potential diversion volumes calcul<strong>at</strong>ed for both unimpaired diversions and diversion withscreening represent the maximum amount <strong>of</strong> w<strong>at</strong>er th<strong>at</strong> could have been diverted under idealconditions. In applic<strong>at</strong>ion, actual flows to ACDT could be intermittently influenced by debrisjam and other fe<strong>at</strong>ures present in real time conditions.Calaveras Reservoir, prior to the Division <strong>of</strong> Safety <strong>of</strong> <strong>Dam</strong>s (DSOD) restriction, periodicallyfilled to capacity and spilled. During years when the reservoir spills, there is a lack <strong>of</strong> capacity inCalaveras Reservoir to store w<strong>at</strong>er th<strong>at</strong> could be potentially diverted from ACDD. Since theconceptual level feasibility analysis in this memorandum does not include development <strong>of</strong> asystems model to integr<strong>at</strong>e historic spill scenarios, w<strong>at</strong>er year types, and the lost w<strong>at</strong>er diversionestim<strong>at</strong>es in Section 5.2, the net effect <strong>of</strong> spills is not assessed in this analysis <strong>of</strong> lost w<strong>at</strong>erdiversion costs.The w<strong>at</strong>er cost analysis is based on the assumption th<strong>at</strong> the SFPUC-proposed normal w<strong>at</strong>er yearinstream flows, including WSIP Final PEIR mitig<strong>at</strong>ion flows, would be bypassed <strong>at</strong> the ACDDwhen available. The SFPUC-proposed instream flows, however, include three different flowschedules to be altern<strong>at</strong>ely implemented depending on the annual hydrological conditions (dry,normal, and wet) (Section 2.3.2.2). A preliminary review indic<strong>at</strong>ed th<strong>at</strong> lost w<strong>at</strong>er costs <strong>at</strong>ACDD, while implementing screens, a fishway, and the normal w<strong>at</strong>er year flow schedule,produced results generally comparable to those th<strong>at</strong> included the other flow schedules (dry andwet). Therefore use <strong>of</strong> the normal w<strong>at</strong>er year flow schedule was assumed to be appropri<strong>at</strong>e forthe level <strong>of</strong> analysis in this conceptual feasibility study.Because it is based on the flows predicted by the model described in Appendix B, the w<strong>at</strong>er costestim<strong>at</strong>e is limited by the accuracy <strong>of</strong> the model. Any inaccuracies inherent in the modeled flowsare propag<strong>at</strong>ed to this w<strong>at</strong>er cost estim<strong>at</strong>e.For the purposes <strong>of</strong> this analysis, and consistent with SFPUC’s commitment to maximizingaqu<strong>at</strong>ic habit<strong>at</strong> under future CDRP oper<strong>at</strong>ions (SFPUC, 2008a), it is assumed th<strong>at</strong> the SFPUCproposedflows (SFPUC, 2009b) are preferentially provided as bypass flows <strong>at</strong> ACDD whenevern<strong>at</strong>ural flows are present.5.3 ANNUALIZED CAPITAL AND OPERATIONS ANDMAINTENANCE COSTSIn this section, capital costs developed in Section 5.1 are annualized and combined with annual w<strong>at</strong>ercosts developed in Section 5.2 and oper<strong>at</strong>ions and maintenance costs (developed in this section) toestim<strong>at</strong>e the total annualized cost <strong>of</strong> fish passage design components <strong>at</strong> ACDD. The designcomponents are also combined to show the total estim<strong>at</strong>ed annualized cost <strong>of</strong> complete fish passageoptions <strong>at</strong> ACDD. The purpose <strong>of</strong> the preliminary cost assessment is to characterize annualized costsfor design components rel<strong>at</strong>ed to fish passage th<strong>at</strong> have been retained up to this point for furtherACDD <strong>Passage</strong> June 2009 Page 5-10
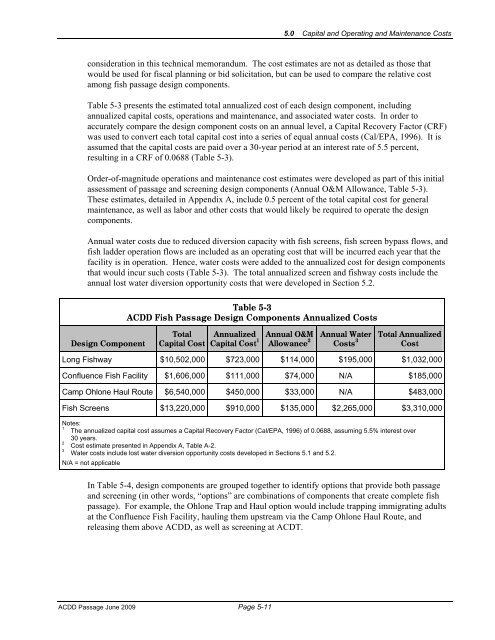
5.0 Capital and Oper<strong>at</strong>ing and Maintenance Costsconsider<strong>at</strong>ion in this technical memorandum. The cost estim<strong>at</strong>es are not as detailed as those th<strong>at</strong>would be used for fiscal planning or bid solicit<strong>at</strong>ion, but can be used to compare the rel<strong>at</strong>ive costamong fish passage design components.Table 5-3 presents the estim<strong>at</strong>ed total annualized cost <strong>of</strong> each design component, includingannualized capital costs, oper<strong>at</strong>ions and maintenance, and associ<strong>at</strong>ed w<strong>at</strong>er costs. In order toaccur<strong>at</strong>ely compare the design component costs on an annual level, a Capital Recovery Factor (CRF)was used to convert each total capital cost into a series <strong>of</strong> equal annual costs (Cal/EPA, 1996). It isassumed th<strong>at</strong> the capital costs are paid over a 30-year period <strong>at</strong> an interest r<strong>at</strong>e <strong>of</strong> 5.5 percent,resulting in a CRF <strong>of</strong> 0.0688 (Table 5-3).Order-<strong>of</strong>-magnitude oper<strong>at</strong>ions and maintenance cost estim<strong>at</strong>es were developed as part <strong>of</strong> this initialassessment <strong>of</strong> passage and screening design components (Annual O&M Allowance, Table 5-3).These estim<strong>at</strong>es, detailed in Appendix A, include 0.5 percent <strong>of</strong> the total capital cost for generalmaintenance, as well as labor and other costs th<strong>at</strong> would likely be required to oper<strong>at</strong>e the designcomponents.Annual w<strong>at</strong>er costs due to reduced diversion capacity with fish screens, fish screen bypass flows, andfish ladder oper<strong>at</strong>ion flows are included as an oper<strong>at</strong>ing cost th<strong>at</strong> will be incurred each year th<strong>at</strong> thefacility is in oper<strong>at</strong>ion. Hence, w<strong>at</strong>er costs were added to the annualized cost for design componentsth<strong>at</strong> would incur such costs (Table 5-3). The total annualized screen and fishway costs include theannual lost w<strong>at</strong>er diversion opportunity costs th<strong>at</strong> were developed in Section 5.2.Table 5-3ACDD <strong>Fish</strong> <strong>Passage</strong> Design Components Annualized CostsDesign ComponentTotalCapital CostAnnualizedCapital Cost 1Annual O&MAllowance 2Annual W<strong>at</strong>erCosts 3Total AnnualizedCostLong <strong>Fish</strong>way $10,502,000 $723,000 $114,000 $195,000 $1,032,000Confluence <strong>Fish</strong> Facility $1,606,000 $111,000 $74,000 N/A $185,000Camp Ohlone Haul Route $6,540,000 $450,000 $33,000 N/A $483,000<strong>Fish</strong> Screens $13,220,000 $910,000 $135,000 $2,265,000 $3,310,000Notes:1The annualized capital cost assumes a Capital Recovery Factor (Cal/EPA, 1996) <strong>of</strong> 0.0688, assuming 5.5% interest over30 years.2Cost estim<strong>at</strong>e presented in Appendix A, Table A-2.3W<strong>at</strong>er costs include lost w<strong>at</strong>er diversion opportunity costs developed in Sections 5.1 and 5.2.N/A = not applicableIn Table 5-4, design components are grouped together to identify options th<strong>at</strong> provide both passageand screening (in other words, “options” are combin<strong>at</strong>ions <strong>of</strong> components th<strong>at</strong> cre<strong>at</strong>e complete fishpassage). For example, the Ohlone Trap and Haul option would include trapping immigr<strong>at</strong>ing adults<strong>at</strong> the Confluence <strong>Fish</strong> Facility, hauling them upstream via the Camp Ohlone Haul Route, andreleasing them above ACDD, as well as screening <strong>at</strong> ACDT.ACDD <strong>Passage</strong> June 2009 Page 5-11