- Page 1 and 2:
www.ministryoftextiles.gov.in
- Page 4:
CONTENTSSl.No. Chapter PageI Highli
- Page 7 and 8:
2ministry of textiles
- Page 10 and 11:
annual report 2010-11(2002-07), Rs.
- Page 12 and 13:
annual report 2010-11iii)iv)value t
- Page 14 and 15:
annual report 2010-11Technology Lev
- Page 16 and 17:
annual report 2010-11Garmenting Uni
- Page 18 and 19:
annual report 2010-11came into effe
- Page 20 and 21:
annual report 2010-11Handloom activ
- Page 22 and 23:
annual report 2010-11NIFT besides c
- Page 24 and 25:
annual report 2010-11CHAPTER IIFUNC
- Page 26 and 27:
annual report 2010-11CHAPTER IIFUNC
- Page 28 and 29:
annual report 2010-11(ii)(TWRFS), a
- Page 30 and 31:
annual report 2010-11(ii)Members of
- Page 32 and 33:
annual report 2010-11●information
- Page 34 and 35:
annual report 2010-11CHAPTER IIITHE
- Page 36 and 37:
annual report 2010-11CHAPTER IIITHE
- Page 38 and 39:
annual report 2010-11Table 3.3PRODU
- Page 40 and 41: annual report 2010-11Table 3.4(Rs.
- Page 42 and 43: annual report 2010-11fulfillment by
- Page 44 and 45: annual report 2010-11Table 3.7S. St
- Page 46 and 47: annual report 2010-11Smt. Rita Meno
- Page 48 and 49: annual report 2010-11CHAPTER IVEXPO
- Page 50 and 51: annual report 2010-11CHAPTER IVEXPO
- Page 52 and 53: annual report 2010-11LIBERALISED TR
- Page 54 and 55: annual report 2010-11IMPORT SCENARI
- Page 56 and 57: annual report 2010-11Statutory Stat
- Page 58 and 59: annual report 2010-11Table 4.2Name
- Page 60 and 61: annual report 2010-11up- gradation,
- Page 62 and 63: annual report 2010-11Table 4.6Batch
- Page 64 and 65: annual report 2010-11AwardsThe Scho
- Page 66 and 67: annual report 2010-11Funding Patter
- Page 68 and 69: annual report 2010-11Table 4.8Physi
- Page 70 and 71: annual report 2010-11CHAPTER VTHE C
- Page 72 and 73: annual report 2010-11CHAPTER VTHE C
- Page 74 and 75: annual report 2010-11significant ca
- Page 76 and 77: annual report 2010-11million kgs. f
- Page 78 and 79: annual report 2010-1131.03.2007. Ho
- Page 80 and 81: annual report 2010-11CHAPTER VITHE
- Page 82 and 83: annual report 2010-11CHAPTER VITHE
- Page 84 and 85: annual report 2010-11Table 6.1Year
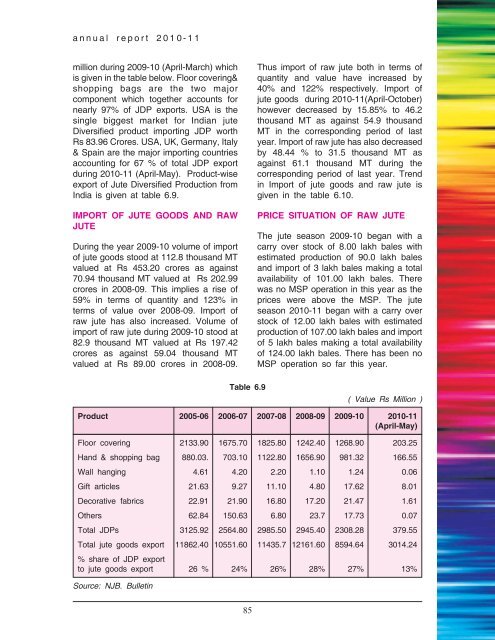
- Page 86 and 87: annual report 2010-11jute are taken
- Page 88 and 89: annual report 2010-11Table 6.6(Qty
- Page 92 and 93: annual report 2010-11●●engaged
- Page 94 and 95: annual report 2010-11mutation breed
- Page 96 and 97: annual report 2010-11Table 6.16Stat
- Page 98 and 99: annual report 2010-11improvement of
- Page 100 and 101: annual report 2010-11(d)ensuring ra
- Page 102 and 103: annual report 2010-11CHAPTER VIISER
- Page 104 and 105: annual report 2010-11CHAPTER VIISER
- Page 106 and 107: annual report 2010-11projects propo
- Page 108 and 109: annual report 2010-11Table 7.3(Dfls
- Page 110 and 111: annual report 2010-11carpets, etc.
- Page 112 and 113: annual report 2010-11utilized for w
- Page 114 and 115: annual report 2010-11man years/year
- Page 116 and 117: annual report 2010-11Table 7.5Sl. S
- Page 118 and 119: annual report 2010-11CSB during Xth
- Page 120 and 121: annual report 2010-11XIII PHYSICAL
- Page 122 and 123: annual report 2010-11CHAPTER VIIITH
- Page 124 and 125: annual report 2010-11CHAPTER VIIITH
- Page 126 and 127: annual report 2010-11●●●Refre
- Page 128 and 129: annual report 2010-11● Improve fi
- Page 130 and 131: annual report 2010-11CHAPTER IXDECE
- Page 132 and 133: annual report 2010-11CHAPTER IXDECE
- Page 134 and 135: annual report 2010-11revised Scheme
- Page 136 and 137: annual report 2010-11Offices & Head
- Page 138 and 139: annual report 2010-11CHAPTER XHANDL
- Page 140 and 141:
annual report 2010-11CHAPTER XHANDL
- Page 142 and 143:
annual report 2010-11●and other O
- Page 144 and 145:
annual report 2010-11child is given
- Page 146 and 147:
annual report 2010-112010. For the
- Page 148 and 149:
annual report 2010-11and Conducting
- Page 150 and 151:
annual report 2010-11Table 10.9(Rs.
- Page 152 and 153:
annual report 2010-11Textiles for p
- Page 154 and 155:
annual report 2010-1111 (April to N
- Page 156 and 157:
annual report 2010-11The following
- Page 158 and 159:
annual report 2010-11CHAPTER XIHAND
- Page 160 and 161:
annual report 2010-11CHAPTER XIHAND
- Page 162 and 163:
annual report 2010-11C. Marketing i
- Page 164 and 165:
annual report 2010-11HUMAN RESOURCE
- Page 166 and 167:
annual report 2010-11●Organising
- Page 168 and 169:
annual report 2010-11The product sp
- Page 170 and 171:
annual report 2010-11covering all m
- Page 172 and 173:
annual report 2010-11●●Organize
- Page 174 and 175:
annual report 2010-11●a life memb
- Page 176 and 177:
annual report 2010-1111. Two projec
- Page 178 and 179:
annual report 2010-11●- Conducted
- Page 180 and 181:
annual report 2010-11CHAPTER XIIPUB
- Page 182 and 183:
annual report 2010-11CHAPTER XIIPUB
- Page 184 and 185:
annual report 2010-11●amount of R
- Page 186 and 187:
annual report 2010-11in the categor
- Page 188 and 189:
annual report 2010-11Table 12.5Sl.N
- Page 190 and 191:
annual report 2010-11ACTION TAKEN B
- Page 192 and 193:
annual report 2010-11Mrs. Gursharan
- Page 194 and 195:
annual report 2010-11The Union Mini
- Page 196 and 197:
annual report 2010-11●proposed to
- Page 198 and 199:
annual report 2010-11winding up of
- Page 200 and 201:
annual report 2010-11Cabinet Decisi
- Page 202 and 203:
annual report 2010-11the same to th
- Page 204 and 205:
annual report 2010-11set up in Febr
- Page 206 and 207:
annual report 2010-11Besides the ab
- Page 208 and 209:
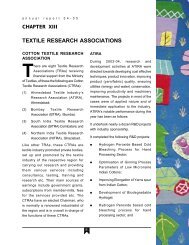
annual report 2010-11CHAPTER XIIITE
- Page 210 and 211:
annual report 2010-11CHAPTER XIIITE
- Page 212 and 213:
annual report 2010-11Programmes con
- Page 214 and 215:
annual report 2010-11of SITRA's tra
- Page 216 and 217:
annual report 2010-11various aspect
- Page 218 and 219:
annual report 2010-11of its kind. I
- Page 220 and 221:
annual report 2010-11Table 13.10Equ
- Page 222 and 223:
annual report 2010-11Table 13.11Equ
- Page 224 and 225:
annual report 2010-11Industrial Dev
- Page 226 and 227:
annual report 2010-119) Development
- Page 228 and 229:
annual report 2010-1113 acres of la
- Page 230 and 231:
annual report 2010-11●●●fibre
- Page 232 and 233:
annual report 2010-11as Indian Jute
- Page 234 and 235:
annual report 2010-11items for the
- Page 236 and 237:
annual report 2010-11development of
- Page 238 and 239:
annual report 2010-11Sector, Appare
- Page 240 and 241:
annual report 2010-11Government Sch
- Page 242 and 243:
annual report 2010-11●Yarn Bank:
- Page 244 and 245:
annual report 2010-11CHAPTER XIVCIT
- Page 246 and 247:
annual report 2010-11CHAPTER XIVCIT
- Page 248 and 249:
annual report 2010-11In the event o
- Page 250 and 251:
annual report 2010-11Stakeholders/C
- Page 252 and 253:
annual report 2010-11S.No.Table 14.
- Page 254 and 255:
annual report 2010-11CHAPTER XVWELF
- Page 256 and 257:
annual report 2010-11CHAPTER XVWELF
- Page 258 and 259:
annual report 2010-11CHAPTER XVITEX
- Page 260 and 261:
annual report 2010-11CHAPTER XVITEX
- Page 262 and 263:
annual report 2010-11Table 16.42009
- Page 264 and 265:
annual report 2010-11CHAPTER XVIIGE
- Page 266 and 267:
annual report 2010-11CHAPTER XVIIGE
- Page 268 and 269:
annual report 2010-11CHAPTER XVIIII
- Page 270 and 271:
annual report 2010-11CHAPTER XVIIII
- Page 272 and 273:
annual report 2010-11sophisticated
- Page 274 and 275:
annual report 2010-11CHAPTER XIXVIG
- Page 276 and 277:
annual report 2010-11CHAPTER XIXVIG
- Page 278 and 279:
annual report 2010-11CHAPTER XXOBSE
- Page 280 and 281:
annual report 2010-11CHAPTER XXOBSE
- Page 282 and 283:
annual report 2010-11●●cent to
- Page 284 and 285:
annual report 2010-11S. Report No.
- Page 286 and 287:
annual report 2010-11CHAPTER XXIPER
- Page 288 and 289:
annual report 2010-11CHAPTER XXIPER
- Page 290:
Design & Printed by: Viba Press Pvt