ethanol fuel production and use in kenya for sustainable ... - lumes
ethanol fuel production and use in kenya for sustainable ... - lumes
ethanol fuel production and use in kenya for sustainable ... - lumes

Create successful ePaper yourself
Turn your PDF publications into a flip-book with our unique Google optimized e-Paper software.
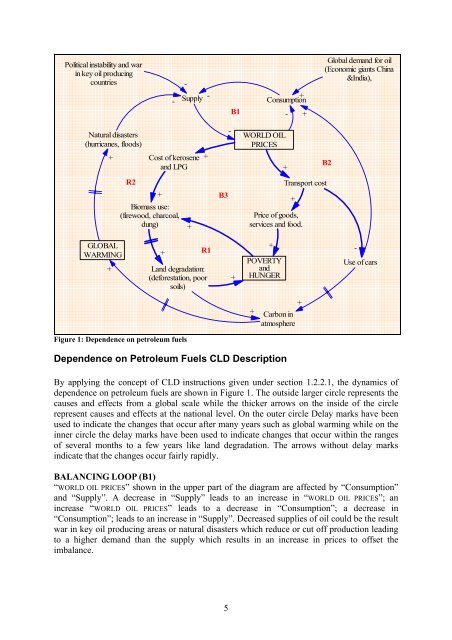
Political <strong>in</strong>stability <strong>and</strong> war<strong>in</strong> key oil produc<strong>in</strong>gcountries -Global dem<strong>and</strong> <strong>for</strong> oil(Economic giants Ch<strong>in</strong>a&India),-Supply-+ConsumptionB1 -+Natural disasters(hurricanes, floods)+Cost of kerosene<strong>and</strong> LPG+-WORLD OILPRICES+B2R2+Biomass <strong>use</strong>:(firewood, charcoal,dung)+B3Price of goods,services <strong>and</strong> food.Transport cost+GLOBALWARMING++R1L<strong>and</strong> degradation:(de<strong>for</strong>estation, poorsoils)++POVERTY<strong>and</strong>HUNGER-Use of cars+Carbon <strong>in</strong>atmosphere+Figure 1: Dependence on petroleum <strong>fuel</strong>sDependence on Petroleum Fuels CLD DescriptionBy apply<strong>in</strong>g the concept of CLD <strong>in</strong>structions given under section 1.2.2.1, the dynamics ofdependence on petroleum <strong>fuel</strong>s are shown <strong>in</strong> Figure 1. The outside larger circle represents theca<strong>use</strong>s <strong>and</strong> effects from a global scale while the thicker arrows on the <strong>in</strong>side of the circlerepresent ca<strong>use</strong>s <strong>and</strong> effects at the national level. On the outer circle Delay marks have been<strong>use</strong>d to <strong>in</strong>dicate the changes that occur after many years such as global warm<strong>in</strong>g while on the<strong>in</strong>ner circle the delay marks have been <strong>use</strong>d to <strong>in</strong>dicate changes that occur with<strong>in</strong> the rangesof several months to a few years like l<strong>and</strong> degradation. The arrows without delay marks<strong>in</strong>dicate that the changes occur fairly rapidly.BALANCING LOOP (B1)“WORLD OIL PRICES” shown <strong>in</strong> the upper part of the diagram are affected by “Consumption”<strong>and</strong> “Supply”. A decrease <strong>in</strong> “Supply” leads to an <strong>in</strong>crease <strong>in</strong> “WORLD OIL PRICES”; an<strong>in</strong>crease “WORLD OIL PRICES” leads to a decrease <strong>in</strong> “Consumption”; a decrease <strong>in</strong>“Consumption”; leads to an <strong>in</strong>crease <strong>in</strong> “Supply”. Decreased supplies of oil could be the resultwar <strong>in</strong> key oil produc<strong>in</strong>g areas or natural disasters which reduce or cut off <strong>production</strong> lead<strong>in</strong>gto a higher dem<strong>and</strong> than the supply which results <strong>in</strong> an <strong>in</strong>crease <strong>in</strong> prices to offset theimbalance.5