ethanol fuel production and use in kenya for sustainable ... - lumes
ethanol fuel production and use in kenya for sustainable ... - lumes
ethanol fuel production and use in kenya for sustainable ... - lumes

Create successful ePaper yourself
Turn your PDF publications into a flip-book with our unique Google optimized e-Paper software.
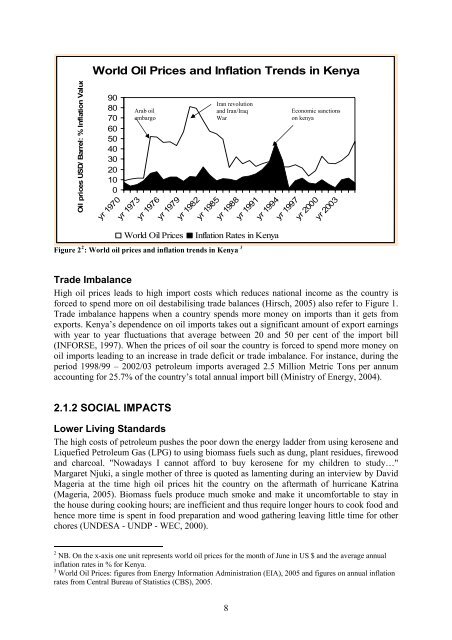
World Oil Prices <strong>and</strong> Inflation Trends <strong>in</strong> KenyaOil prices USD/ Barrel: % Inflation Value9080706050403020100yr 1970yr 1973Arab oilembargoyr 1976yr 1979yr 1982yr 1985Iran revolution<strong>and</strong> Iran/IraqWaryr 1988yr 1991yr 1994Economic sanctionson <strong>kenya</strong>yr 1997yr 2000yr 2003World Oil PricesInflation Rates <strong>in</strong> KenyaFigure 2 2 : World oil prices <strong>and</strong> <strong>in</strong>flation trends <strong>in</strong> Kenya 3Trade ImbalanceHigh oil prices leads to high import costs which reduces national <strong>in</strong>come as the country is<strong>for</strong>ced to spend more on oil destabilis<strong>in</strong>g trade balances (Hirsch, 2005) also refer to Figure 1.Trade imbalance happens when a country spends more money on imports than it gets fromexports. Kenya’s dependence on oil imports takes out a significant amount of export earn<strong>in</strong>gswith year to year fluctuations that average between 20 <strong>and</strong> 50 per cent of the import bill(INFORSE, 1997). When the prices of oil soar the country is <strong>for</strong>ced to spend more money onoil imports lead<strong>in</strong>g to an <strong>in</strong>crease <strong>in</strong> trade deficit or trade imbalance. For <strong>in</strong>stance, dur<strong>in</strong>g theperiod 1998/99 – 2002/03 petroleum imports averaged 2.5 Million Metric Tons per annumaccount<strong>in</strong>g <strong>for</strong> 25.7% of the country’s total annual import bill (M<strong>in</strong>istry of Energy, 2004).2.1.2 SOCIAL IMPACTSLower Liv<strong>in</strong>g St<strong>and</strong>ardsThe high costs of petroleum pushes the poor down the energy ladder from us<strong>in</strong>g kerosene <strong>and</strong>Liquefied Petroleum Gas (LPG) to us<strong>in</strong>g biomass <strong>fuel</strong>s such as dung, plant residues, firewood<strong>and</strong> charcoal. "Nowadays I cannot af<strong>for</strong>d to buy kerosene <strong>for</strong> my children to study…"Margaret Njuki, a s<strong>in</strong>gle mother of three is quoted as lament<strong>in</strong>g dur<strong>in</strong>g an <strong>in</strong>terview by DavidMageria at the time high oil prices hit the country on the aftermath of hurricane Katr<strong>in</strong>a(Mageria, 2005). Biomass <strong>fuel</strong>s produce much smoke <strong>and</strong> make it uncom<strong>for</strong>table to stay <strong>in</strong>the ho<strong>use</strong> dur<strong>in</strong>g cook<strong>in</strong>g hours; are <strong>in</strong>efficient <strong>and</strong> thus require longer hours to cook food <strong>and</strong>hence more time is spent <strong>in</strong> food preparation <strong>and</strong> wood gather<strong>in</strong>g leav<strong>in</strong>g little time <strong>for</strong> otherchores (UNDESA - UNDP - WEC, 2000).2 NB. On the x-axis one unit represents world oil prices <strong>for</strong> the month of June <strong>in</strong> US $ <strong>and</strong> the average annual<strong>in</strong>flation rates <strong>in</strong> % <strong>for</strong> Kenya.3 World Oil Prices: figures from Energy In<strong>for</strong>mation Adm<strong>in</strong>istration (EIA), 2005 <strong>and</strong> figures on annual <strong>in</strong>flationrates from Central Bureau of Statistics (CBS), 2005.8