The European e-Business Report 2004 - Berlecon Research GmbH
The European e-Business Report 2004 - Berlecon Research GmbH
The European e-Business Report 2004 - Berlecon Research GmbH
You also want an ePaper? Increase the reach of your titles
YUMPU automatically turns print PDFs into web optimized ePapers that Google loves.
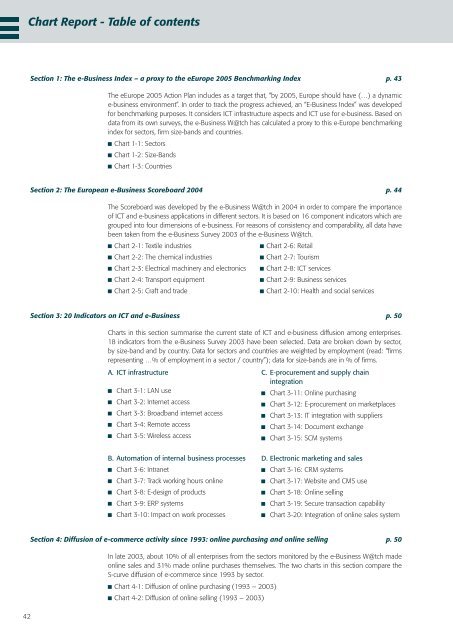
Chart <strong>Report</strong> - Table of contentsSection 1: <strong>The</strong> e-<strong>Business</strong> Index – a proxy to the eEurope 2005 Benchmarking Index p. 43<strong>The</strong> eEurope 2005 Action Plan includes as a target that, “by 2005, Europe should have (…) a dynamice-business environment”. In order to track the progress achieved, an “E-<strong>Business</strong> Index” was developedfor benchmarking purposes. It considers ICT infrastructure aspects and ICT use for e-business. Based ondata from its own surveys, the e-<strong>Business</strong> W@tch has calculated a proxy to this e-Europe benchmarkingindex for sectors, fi rm size-bands and countries.Chart 1-1: SectorsChart 1-2: Size-BandsChart 1-3: CountriesSection 2: <strong>The</strong> <strong>European</strong> e-<strong>Business</strong> Scoreboard <strong>2004</strong> p. 44<strong>The</strong> Scoreboard was developed by the e-<strong>Business</strong> W@tch in <strong>2004</strong> in order to compare the importanceof ICT and e-business applications in different sectors. It is based on 16 component indicators which aregrouped into four dimensions of e-business. For reasons of consistency and comparability, all data havebeen taken from the e-<strong>Business</strong> Survey 2003 of the e-<strong>Business</strong> W@tch.Chart 2-1: Textile industriesChart 2-6: RetailChart 2-2: <strong>The</strong> chemical industriesChart 2-7: TourismChart 2-3: Electrical machinery and electronics Chart 2-8: ICT servicesChart 2-4: Transport equipmentChart 2-9: <strong>Business</strong> servicesChart 2-5: Craft and tradeChart 2-10: Health and social servicesSection 3: 20 Indicators on ICT and e-<strong>Business</strong> p. 50Charts in this section summarise the current state of ICT and e-business diffusion among enterprises.18 indicators from the e-<strong>Business</strong> Survey 2003 have been selected. Data are broken down by sector,by size-band and by country. Data for sectors and countries are weighted by employment (read: “fi rmsrepresenting …% of employment in a sector / country”); data for size-bands are in % of fi rms.A. ICT infrastructureChart 3-1: LAN useChart 3-2: Internet accessChart 3-3: Broadband internet accessChart 3-4: Remote accessChart 3-5: Wireless accessC. E-procurement and supply chainintegrationChart 3-11: Online purchasingChart 3-12: E-procurement on marketplacesChart 3-13: IT integration with suppliersChart 3-14: Document exchangeChart 3-15: SCM systemsB. Automation of internal business processesChart 3-6: IntranetChart 3-7: Track working hours onlineChart 3-8: E-design of productsChart 3-9: ERP systemsChart 3-10: Impact on work processesD. Electronic marketing and salesChart 3-16: CRM systemsChart 3-17: Website and CMS useChart 3-18: Online sellingChart 3-19: Secure transaction capabilityChart 3-20: Integration of online sales system42Section 4: Diffusion of e-commerce activity since 1993: online purchasing and online selling p. 50In late 2003, about 10% of all enterprises from the sectors monitored by the e-<strong>Business</strong> W@tch madeonline sales and 31% made online purchases themselves. <strong>The</strong> two charts in this section compare theS-curve diffusion of e-commerce since 1993 by sector.Chart 4-1: Diffusion of online purchasing (1993 – 2003)Chart 4-2: Diffusion of online selling (1993 – 2003)


