- Page 1 and 2:
LOAD AND RESISTANCEFACTOR DESIGNSPE
- Page 3:
iiCopyright © 2000byAmerican Insti
- Page 6 and 7:
vTABLE OF CONTENTSSYMBOLS . . . . .
- Page 8 and 9:
TABLE OF CONTENTSviiSPECIFICATION (
- Page 10 and 11:
TABLE OF CONTENTSixSPECIFICATION (C
- Page 12 and 13:
TABLE OF CONTENTSxiCOMMENTARY (Cont
- Page 18 and 19:
SYMBOLSxviistrength (for those stee
- Page 20 and 21:
SYMBOLSxixS eff Effective section m
- Page 22 and 23:
SYMBOLSxxit s Web stiffener thickne
- Page 24 and 25:
xxiiiGLOSSARYAlignment chart for co
- Page 26 and 27:
GLOSSARYxxvEffective moment of iner
- Page 28 and 29:
GLOSSARYxxviiLateral bracing member
- Page 30 and 31:
GLOSSARYxxixPost-buckling strength.
- Page 32 and 33:
GLOSSARYxxxiStrain-hardening strain
- Page 34 and 35:
1CHAPTER AGENERAL PROVISIONSA1. SCO
- Page 36 and 37:
Sect. A3.] MATERIAL 3Cold-Formed We
- Page 38 and 39:
Sect. A3.] MATERIAL 5ASTM A449 bolt
- Page 40 and 41:
Sect. A6.] REFERENCED CODES AND STA
- Page 42 and 43:
Sect. A7.] DESIGN DOCUMENTS 9tion A
- Page 44 and 45:
Sect. B4.] STABILITY 11(a) When the
- Page 46 and 47:
Sect. B10.] PROPORTIONS OF BEAMS AN
- Page 48 and 49:
Sect. B10.] PROPORTIONS OF BEAMS AN
- Page 50 and 51:
17Chap. CCHAPTER CFRAMES AND OTHER
- Page 52 and 53:
Sect. C3.] STABILITY BRACING 19all
- Page 54 and 55:
Sect. C3.] STABILITY BRACING 214. B
- Page 56 and 57:
Sect. C3.] STABILITY BRACING 231.0;
- Page 58 and 59:
Sect. D3.] PIN-CONNECTED MEMBERS AN
- Page 60 and 61:
27Chap. ECHAPTER ECOLUMNS AND OTHER
- Page 62 and 63:
Sect. E4.] BUILT-UP MEMBERS 29(a) F
- Page 64 and 65:
31Chap. FCHAPTER FBEAMS AND OTHER F
- Page 66 and 67:
Sect. F1.] DESIGN FOR FLEXURE 33Lp=
- Page 68 and 69:
Sect. F2.] DESIGN FOR SHEAR 35Lpd
- Page 70 and 71:
37Chap. GCHAPTER GPLATE GIRDERSI-sh
- Page 72 and 73:
Sect. H3.] ALTERNATIVE INTERACTION
- Page 74 and 75:
Sect. I2.] COMPRESSION MEMBERS 41ti
- Page 76 and 77:
Sect. I3.] FLEXURAL MEMBERS 434. Lo
- Page 78 and 79:
Sect. I3.] FLEXURAL MEMBERS 45welde
- Page 80 and 81:
Sect. I5.] SHEAR CONNECTORS 47A c =
- Page 82 and 83:
49Chap. JCHAPTER JCONNECTIONS, JOIN
- Page 84 and 85:
Sect. J1.] GENERAL PROVISIONS 518.
- Page 86 and 87:
Sect. J2.] WELDS 53Welding ProcessT
- Page 88 and 89:
Sect. J2.] WELDS 55For end-loaded f
- Page 90 and 91:
Sect. J2.] WELDS 57Types of Weld an
- Page 92 and 93:
Sect. J3.] BOLTS AND THREADED PARTS
- Page 94 and 95:
Sect. J3.] BOLTS AND THREADED PARTS
- Page 96 and 97:
Sect. J3.] BOLTS AND THREADED PARTS
- Page 98 and 99:
Sect. J3.] BOLTS AND THREADED PARTS
- Page 100 and 101:
Sect. J4.] DESIGN RUPTURE STRENGTH
- Page 102 and 103:
Sect. J8.] BEARING STRENGTH 69J6. F
- Page 104 and 105:
71Chap. KCHAPTER KCONCENTRATED FORC
- Page 106 and 107:
Sect. K1.] FLANGES AND WEBS WITH CO
- Page 108 and 109:
For P u 0.4P yR v = 0.60F y d c t
- Page 110 and 111:
Sect. K3.] DESIGN FOR CYCLIC LOADIN
- Page 112 and 113:
79Chap. LCHAPTER LSERVICEABILITY DE
- Page 114 and 115:
81Chap. MCHAPTER MFABRICATION, EREC
- Page 116 and 117:
Sect. M4.] ERECTION 83(2) Bottom su
- Page 118 and 119:
Sect. M5.] QUALITY CONTROL 85The fa
- Page 120 and 121:
Sect. N3.] EVALUATION BY STRUCTURAL
- Page 122 and 123:
89App. BAPPENDIX BDESIGN REQUIREMEN
- Page 124 and 125:
App. B5.] LOCAL BUCKLING 914kc=h/tw
- Page 126 and 127:
App. B5.] LOCAL BUCKLING 93é0.877
- Page 128 and 129:
App. E3.] DESIGN COMPRESSIVE STRENG
- Page 130 and 131:
App. F1.] DESIGN FOR FLEXURE 97For
- Page 132 and 133:
App. F1.] DESIGN FOR FLEXURE 99TABL
- Page 134 and 135:
App. F1.] DESIGN FOR FLEXURE 101Cri
- Page 136 and 137:
App. F3.] WEB-TAPERED MEMBERS 103j
- Page 138 and 139:
App. F3.] WEB-TAPERED MEMBERS 105Fw
- Page 140 and 141:
107App. GAPPENDIX GPLATE GIRDERSThi
- Page 142 and 143:
App. G3.] DESIGN SHEAR STRENGTH 109
- Page 144 and 145:
App. G5.] FLEXURE-SHEAR INTERACTION
- Page 146 and 147:
App. H3.] ALTERNATIVE INTERACTION E
- Page 148 and 149:
115App. JAPPENDIX JCONNECTIONS, JOI
- Page 150 and 151:
App. J3.] BOLTS AND THREADED PARTS
- Page 152 and 153:
App. K2.] PONDING 119æçMetric:lC
- Page 154 and 155:
App. K3.] DESIGN FOR CYCLIC LOADING
- Page 156 and 157: App. K3.] DESIGN FOR CYCLIC LOADING
- Page 158 and 159: App. K3.] DESIGN FOR CYCLIC LOADING
- Page 160 and 161: App. K3.] DESIGN FOR CYCLIC LOADING
- Page 162 and 163: App. K3.] DESIGN FOR CYCLIC LOADING
- Page 164 and 165: App. K3.] DESIGN FOR CYCLIC LOADING
- Page 166 and 167: App. K3.] DESIGN FOR CYCLIC LOADING
- Page 168 and 169: App. K3.] DESIGN FOR CYCLIC LOADING
- Page 170 and 171: App. K3.] DESIGN FOR CYCLIC LOADING
- Page 172 and 173: App. K3.] DESIGN FOR CYCLIC LOADING
- Page 174 and 175: NUMERICAL VALUES 141TABLE 2ItemShap
- Page 176 and 177: NUMERICAL VALUES 143Klr123456789101
- Page 178 and 179: NUMERICAL VALUES 145TABLE 3-50Desig
- Page 180 and 181: NUMERICAL VALUES 147TABLE 4Values o
- Page 182 and 183: NUMERICAL VALUES 149TABLE 5 (cont
- Page 184 and 185: NUMERICAL VALUES 151TABLE 7Values o
- Page 186 and 187: NUMERICAL VALUES 153f vVAwnTABLE 8-
- Page 188 and 189: NUMERICAL VALUES 155f vVAwnTABLE 8-
- Page 190 and 191: NUMERICAL VALUES 157hf vVAwnTABLE 9
- Page 192 and 193: NUMERICAL VALUES 159f vVAwnTABLE 9-
- Page 194 and 195: NUMERICAL VALUES 161ht wf vVAwnTABL
- Page 196 and 197: 163COMMENTARYon the Load and Resist
- Page 198 and 199: Comm. A2.] TYPES OF CONSTRUCTION 16
- Page 200 and 201: Comm. A3.] MATERIAL 167and Chen, 19
- Page 202 and 203: Comm. A3.] MATERIAL 169than the ant
- Page 204 and 205: Comm. A4.] LOADS AND LOAD COMBINATI
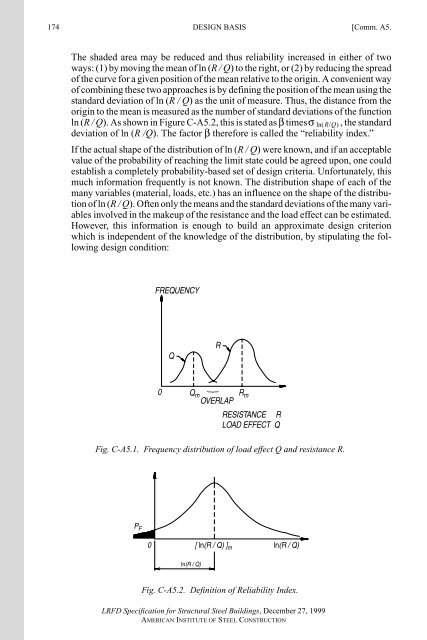
- Page 208 and 209: Comm. A5.] DESIGN BASIS 175( )bsln(
- Page 210 and 211: 177Comm. BCHAPTER BDESIGN REQUIREME
- Page 212 and 213: Comm. B5.] LOCAL BUCKLING 179(c) Al
- Page 214 and 215: Comm. B5.] LOCAL BUCKLING 181load.
- Page 216 and 217: Comm. B7.] LIMITING SLENDERNESS RAT
- Page 218 and 219: Comm. C1.] SECOND ORDER EFFECTS 185
- Page 220 and 221: Comm. C1.] SECOND ORDER EFFECTS 187
- Page 222 and 223: Comm. C2.] FRAME STABILITY 189Buckl
- Page 224 and 225: Comm. C2.] FRAME STABILITY 191Notes
- Page 226 and 227: Comm. C2.] FRAME STABILITY 193Where
- Page 228 and 229: Comm. C3.] STABILITY BRACING 195age
- Page 230 and 231: Comm. C3.] STABILITY BRACING 197pla
- Page 232 and 233: Comm. C3.] STABILITY BRACING 199The
- Page 234 and 235: Comm. C3.] STABILITY BRACING 201Par
- Page 236 and 237: 203Comm. ECHAPTER ECOLUMNS AND OTHE
- Page 238 and 239: Comm. E4.] BUILT-UP MEMBERS 205TABL
- Page 240 and 241: Comm. F1.] DESIGN FOR FLEXURE 207ha
- Page 242 and 243: Comm. F1.] DESIGN FOR FLEXURE 2092b
- Page 244 and 245: Comm. F4.] BEAMS AND GIRDERS WITH W
- Page 246 and 247: Comm. H2.] UNSYMMETRIC MEMBERS AND
- Page 248 and 249: Comm. I2.] COMPRESSION MEMBERS 215d
- Page 250 and 251: Comm. I3.] FLEXURAL MEMBERS 217may
- Page 252 and 253: Comm. I3.] FLEXURAL MEMBERS 219The
- Page 254 and 255: Comm. I3.] FLEXURAL MEMBERS 221wher
- Page 256 and 257:
Comm. I3.] FLEXURAL MEMBERS 223proc
- Page 258 and 259:
Comm. I4.] COMBINED COMPRESSION AND
- Page 260 and 261:
Comm. I5.] SHEAR CONNECTORS 227tal
- Page 262 and 263:
229Comm. JCHAPTER JCONNECTIONS, JOI
- Page 264 and 265:
Comm. J1.] GENERAL PROVISIONS 231 P
- Page 266 and 267:
Comm. J2.] WELDS 2332b. Limitations
- Page 268 and 269:
Comm. J2.] WELDS 235When longitudin
- Page 270 and 271:
Comm. J2.] WELDS 237due to cyclic f
- Page 272 and 273:
Comm. J2.] WELDS 239(b) Plane 2-2,
- Page 274 and 275:
Comm. J3.] BOLTS AND THREADED PARTS
- Page 276 and 277:
Comm. J3.] BOLTS AND THREADED PARTS
- Page 278 and 279:
Comm. J3.] BOLTS AND THREADED PARTS
- Page 280 and 281:
Comm. J4.] DESIGN RUPTURE STRENGTH
- Page 282 and 283:
249Comm. KCHAPTER KCONCENTRATED FOR
- Page 284 and 285:
Comm. K1.] FLANGES AND WEBS WITH CO
- Page 286 and 287:
Comm. K1.] FLANGES AND WEBS WITH CO
- Page 288 and 289:
Comm. K2.] PONDING 255Even on the b
- Page 290 and 291:
257Comm. LCHAPTER LSERVICEABILITY D
- Page 292 and 293:
Comm. L5.] CORROSION 259orthotropic
- Page 294 and 295:
Comm. M4.] ERECTION 261It is sugges
- Page 296 and 297:
Comm. N4.] EVALUATION BY LOAD TESTS
- Page 298 and 299:
Comm. N5.] EVALUATION REPORT 265N5.
- Page 300 and 301:
267Comm. A-EAPPENDIX ECOLUMNS AND O
- Page 302 and 303:
Comm. App. F3.] WEB-TAPERED MEMBERS
- Page 304 and 305:
271Comm. A-GAPPENDIX GPLATE GIRDERS
- Page 306 and 307:
273Comm. A-KAPPENDIX JCONNECTIONS,
- Page 308 and 309:
Comm. J2.] WELDS 275found to be con
- Page 310 and 311:
Comm. K3.] DESIGN FOR CYCLIC LOADIN
- Page 312 and 313:
279ReferencesAckroyd, M. H., and Ge
- Page 314 and 315:
REFERENCES 281Bjorhovde, R. (1972),
- Page 316 and 317:
REFERENCES 283Fielding, D. J., and
- Page 318 and 319:
REFERENCES 285Johnson, D. L. (1985)
- Page 320 and 321:
REFERENCES 287Ollgaard, J. G., Slut
- Page 322 and 323:
REFERENCES 289Zhou, S. P., and Chen
- Page 324 and 325:
SUPPLEMENTARY BIBLIOGRAPHY 291Kotec
- Page 326 and 327:
Metric Conversion Factors for Commo