- Page 1 and 2:
Beginning and Intermediate Algebra
- Page 3 and 4:
Special thanks to: My beautiful wif
- Page 5 and 6:
Chapter 6: Factoring 6.1 Greatest C
- Page 7 and 8:
0.1 Pre-Algebra - Integers Objectiv
- Page 9 and 10:
Multiplication and division of inte
- Page 11 and 12:
45) (4)( − 6) Find each quotient.
- Page 13 and 14:
9 ÷ 3 3 = 21 ÷ 3 7 Our Soultion T
- Page 15 and 16:
Example 21. 13 6 − 9 6 4 6 2 3 Sa
- Page 17 and 18:
Find each quotient. 37) − 2 ÷ 7
- Page 19 and 20:
the expression that is to be evalua
- Page 21 and 22:
Solve. 1) − 6 · 4( − 1) 3) 3+(
- Page 23 and 24:
It will be more common in our study
- Page 25 and 26:
0.4 Practice - Properties of Algebr
- Page 27 and 28:
Chapter 1 : Solving Linear Equation
- Page 29 and 30:
Addition Problems To solve equation
- Page 31 and 32:
8x = − 24 8 8 x = − 3 Division
- Page 33 and 34:
1.2 Linear Equations - Two-Step Equ
- Page 35 and 36:
− 1 − 1 Divide both sides by
- Page 37 and 38:
1.3 Solving Linear Equations - Gene
- Page 39 and 40:
Example 63. − 3x +9=6x − 27 Not
- Page 41 and 42:
4[ − 2]+9=−15 +8(2) Finish mult
- Page 43 and 44:
1.4 Solving Linear Equations - Frac
- Page 45 and 46:
Example 72. � � 3 5 4 x + = 3 2
- Page 47 and 48:
1.5 Solving Linear Equations - Form
- Page 49 and 50:
Example 79. A = πr 2 +πrs for s S
- Page 51 and 52: 1.5 Practice - Formulas Solve each
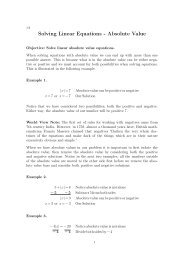
- Page 53 and 54: |x| = 5 Absolute value can be posit
- Page 55 and 56: Example 90. 7+|2x − 5| =4 Notice
- Page 57 and 58: 1.7 Solving Linear Equations - Vari
- Page 59 and 60: Once we have found the constant of
- Page 61 and 62: 1.7 Practice - Variation Write the
- Page 63 and 64: sure. If the pressure of a certain
- Page 65 and 66: Fifteen more than three times a num
- Page 67 and 68: When we started with our first, sec
- Page 69 and 70: 1.8 Practice - Number and Geometry
- Page 71 and 72: 30. The perimeter of a college bask
- Page 73 and 74: Our equation comes from the future
- Page 75 and 76: 4x + 2=102 Solve the two − step e
- Page 77 and 78: years ago, the bronze plaque was on
- Page 79 and 80: 1.10 Solving Linear Equations - Dis
- Page 81 and 82: Rate Time Distance Bob r + 2 3 Fred
- Page 83 and 84: 2 =t Our solution fort, she catches
- Page 85 and 86: Find the distance he rode. 8. A man
- Page 87 and 88: The first plan is flying 25 mph slo
- Page 89 and 90: 2.1 Graphing - Points and Lines Obj
- Page 91 and 92: E B D F G C A Our Solution The main
- Page 93 and 94: x y − 3 − 4 0 − 2 3 0 Our com
- Page 95 and 96: 2.2 Graphing - Slope Objective: Fin
- Page 97 and 98: When mathematicians began working w
- Page 99 and 100: Example 131. Find the value of x be
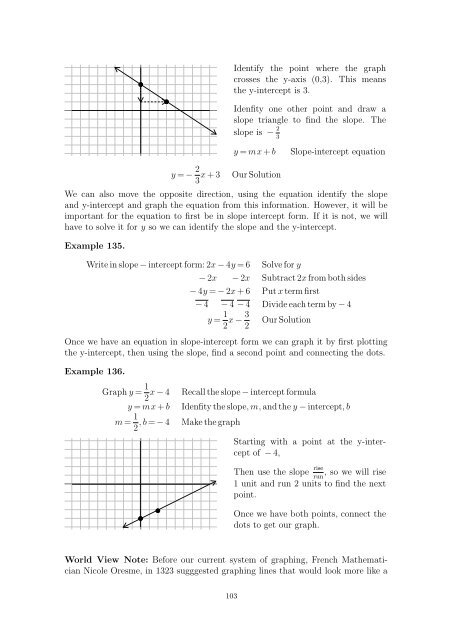
- Page 101: 9) 10) Find the slope of the line t
- Page 105 and 106: 2.3 Practice - Slope-Intercept Writ
- Page 107 and 108: 2.4 Graphing - Point-Slope Form Obj
- Page 109 and 110: Find the equation of the line throu
- Page 111 and 112: Write the point-slope form of the e
- Page 113 and 114: m = 2 5 m = 2 5 Example 147. Slope
- Page 115 and 116: 2.5 Practice - Parallel and Perpend
- Page 117 and 118: Chapter 3 : Inequalities 3.1 Solve
- Page 119 and 120: than 4. If we have an expression su
- Page 121 and 122: − 5 − 5 − 2x � 6 Divide bot
- Page 123 and 124: Solve each inequality, graph each s
- Page 125 and 126: As the graphs overlap, we take the
- Page 127 and 128: 3.2 Practice - Compound Inequalitie
- Page 129 and 130: edition of a college algebra text!
- Page 131 and 132: It is important to remember as we a
- Page 133 and 134: Chapter 4 : Systems of Equations 4.
- Page 135 and 136: ested in the point that is a soluti
- Page 137 and 138: that parallel lines have the same s
- Page 139 and 140: 4.2 Systems of Equations - Substitu
- Page 141 and 142: tion. This process is described and
- Page 143 and 144: World View Note: French mathematici
- Page 145 and 146: 31) 2x + y = 2 3x + 7y = 14 33) x +
- Page 147 and 148: 6x +9y = 6 New second equation −
- Page 149 and 150: Just as with graphing and substutio
- Page 151 and 152: 4.4 Systems of Equations - Three Va
- Page 153 and 154:
just the ordered pair (x, y). In th
- Page 155 and 156:
15x − 12y +9z = − 12 5x − 4y
- Page 157 and 158:
23) 3x + 3y − 2z = 13 6x + 2y −
- Page 159 and 160:
are given to use. This means someti
- Page 161 and 162:
− 0.5 − 0.5 c=17 We have c, num
- Page 163 and 164:
− 0.06x − 0.06y = − 240 Add e
- Page 165 and 166:
14) A bank contains 27 coins in dim
- Page 167 and 168:
4.6 Systems of Equations - Mixture
- Page 169 and 170:
Amount Part Total Start 40 3 120 Ad
- Page 171 and 172:
4(30 −n)+2.5n=105 Substitute into
- Page 173 and 174:
16) A certain grade of milk contain
- Page 175 and 176:
175
- Page 177 and 178:
5.1 Polynomials - Exponent Properti
- Page 179 and 180:
A quicker method to arrive at the s
- Page 181 and 182:
Example 210. Example 211. 7a 3 (2a
- Page 183 and 184:
5.2 Polynomials - Negative Exponent
- Page 185 and 186:
As we simplified our fraction we to
- Page 187 and 188:
5.2 Practice - Negative Exponents S
- Page 189 and 190:
Example 223. Convert 3.21 × 10 5 t
- Page 191 and 192:
5.3 Practice - Scientific Notation
- Page 193 and 194:
World View Note: Ada Lovelace in 18
- Page 195 and 196:
21) (3+b 4 )+(7+2b + b 4 ) 22) (1+6
- Page 197 and 198:
Just as we distribute a monomial th
- Page 199 and 200:
Example 243. (2x − 5)(4x 2 − 7x
- Page 201 and 202:
5.6 Polynomials - Multiply Special
- Page 203 and 204:
Be very careful when we are squarin
- Page 205 and 206:
5.7 Polynomials - Divide Polynomial
- Page 207 and 208:
3. Change the sign of the terms and
- Page 209 and 210:
Example 261. 2x 3 + 42 − 4x x + 3
- Page 211 and 212:
Chapter 6 : Factoring 6.1 Greatest
- Page 213 and 214:
ers using mental math, then we take
- Page 215 and 216:
6.1 Practice - Greatest Common Fact
- Page 217 and 218:
Example 273. 10ab + 15b + 4a+6 Spli
- Page 219 and 220:
example the binomials are (a + b) a
- Page 221 and 222:
6.3 Factoring - Trinomials where a
- Page 223 and 224:
As the past few examples illustrate
- Page 225 and 226:
6.3 Practice - Trinomials where a =
- Page 227 and 228:
Example 296. 10x 2 − 27x +5 Multi
- Page 229 and 230:
6.5 Factoring - Factoring Special P
- Page 231 and 232:
Example 306. 4x 2 + 20xy + 25y 2 Mu
- Page 233 and 234:
6.5 Practice - Factoring Special Pr
- Page 235 and 236:
Example 313. Example 314. Example 3
- Page 237 and 238:
6.7 Factoring - Solve by Factoring
- Page 239 and 240:
0=(2x +3)(2x − 3) One factor must
- Page 241 and 242:
6.7 Practice - Solve by Factoring S
- Page 243 and 244:
7.1 Rational Expressions - Reduce R
- Page 245 and 246:
However, if there is more than just
- Page 247 and 248:
41) 8m+16 20m − 12 43) 2x2 − 10
- Page 249 and 250:
Example 333. 25x2 24y4 · 9y8 55x7
- Page 251 and 252:
Simplify each expression. 1) 8x2 9
- Page 253 and 254:
7.3 Rational Expressions - Least Co
- Page 255 and 256:
As the above example illustrates, w
- Page 257 and 258:
7.4 Rational Expressions - Add & Su
- Page 259 and 260:
13 12 Our Solution The same process
- Page 261 and 262:
7.4 Practice - Add and Subtract Add
- Page 263 and 264:
2(12) 1(12) − 3 4 5(12) 1(12) + 6
- Page 265 and 266:
LCD =(x + 3)(x − 3) Multiply each
- Page 267 and 268:
23) 25) 27) 29) x − 4+ 9 2x +3 x
- Page 269 and 270:
(20)(9)=6x Multiply 180 = 6x Divide
- Page 271 and 272:
3.5 6 The man hasashadow of 3.5 fee
- Page 273 and 274:
33) Kali reduced the size of a pain
- Page 275 and 276:
LCD will be more involved. We will
- Page 277 and 278:
x=5 or − 2 Our Solution World Vie
- Page 279 and 280:
7.8 Rational Expressions - Dimensio
- Page 281 and 282:
� 435 1 �� � 1 lbs = 16 435
- Page 283 and 284:
To focus on the process of conversi
- Page 285 and 286:
7.8 Practice - Dimensional Analysis
- Page 287 and 288:
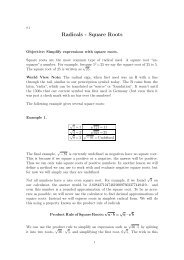
Chapter 8 : Radicals 8.1 Square Roo
- Page 289 and 290:
√ process is being able to transl
- Page 291 and 292:
Simplify. √ 1) 245 √ 3) 36 √
- Page 293 and 294:
Example 384. 3√ 54 We are working
- Page 295 and 296:
8.3 Radicals - Adding Radicals Obje
- Page 297 and 298:
Simiplify 1) 2 5 √ + 2 5 √ + 2
- Page 299 and 300:
√ √ √ √ 4 50 + 6 30 − 8 3
- Page 301 and 302:
The previous example could have bee
- Page 303 and 304:
8.5 Radicals - Rationalize Denomina
- Page 305 and 306:
2x2 √ √ 10 − 6x 3x Our Soluti
- Page 307 and 308:
Example 408. 2 5 √ − 3 7 √ 5
- Page 309 and 310:
37) 5 2 √ + 3 √ 5+5 2 √ 38) 3
- Page 311 and 312:
1 (3) 4 Evaluate exponent 1 81 Our
- Page 313 and 314:
8.6 Practice - Rational Exponents W
- Page 315 and 316:
Example 420. ab2 3√ a2 4√ b Rew
- Page 317 and 318:
8.7 Practice - Radicals of Mixed In
- Page 319 and 320:
Example 426. Example 427. i 35 Divi
- Page 321 and 322:
√ Dividing with complex numbers a
- Page 323 and 324:
Simplify. 1) 3 − ( − 8+4i) 3) (
- Page 325 and 326:
Chapter 9 : Quadratics 9.1 Solving
- Page 327 and 328:
Example 444. + 1 +1 Add1to both sid
- Page 329 and 330:
2 − 2=0 Subtract 0=0 True! It wor
- Page 331 and 332:
Solve. √ 1) 2x + 3 √ 3) 6x −
- Page 333 and 334:
x4 4√ = ± 4√ 16 Simplify roots
- Page 335 and 336:
5√ 4x +1 = ± 3 Clear radical by
- Page 337 and 338:
9.3 Quadratics - Complete the Squar
- Page 339 and 340:
x2 + 5 25 x+ 3 36 � x + 5 �2 6
- Page 341 and 342:
Example 464. − 7 3 � 3 3 + 3 3
- Page 343 and 344:
9.4 Quadratics - Quadratic Formula
- Page 345 and 346:
x = Example 468. √ 30 ± 900 + 11
- Page 347 and 348:
9.4 Practice - Quadratic Formula So
- Page 349 and 350:
12x 2 − 17x + 6=0 Our Solution If
- Page 351 and 352:
9.5 Practice - Build Quadratics fro
- Page 353 and 354:
Example 479. a −2 − a −1 −
- Page 355 and 356:
12 = (x − 3) 2 or 13 =(x − 3) 2
- Page 357 and 358:
9.7 Quadratics - Rectangles Objecti
- Page 359 and 360:
Example 486. 2 Our Solution The len
- Page 361 and 362:
4(x 2 + 10x − 24) =0 Factor trino
- Page 363 and 364:
that require 24 square meters for p
- Page 365 and 366:
1(12x) 3 + 1(12x) x 1 1 5 + = 3 x 1
- Page 367 and 368:
6x +6(x − 1)=5x(x − 1) Reduce e
- Page 369 and 370:
16) A sink can be filled from the f
- Page 371 and 372:
These simultaneous product equation
- Page 373 and 374:
9.10 Quadratics - Revenue and Dista
- Page 375 and 376:
96n(n − 2) 96n(n − 2) +4n(n −
- Page 377 and 378:
upstream, the current will pull aga
- Page 379 and 380:
12) A pilot flying at a constant ra
- Page 381 and 382:
The above method to graph a parabol
- Page 383 and 384:
It is important to remember the gra
- Page 385 and 386:
Chapter 10 : Functions 10.1 Functio
- Page 387 and 388:
Example 504. Which of the following
- Page 389 and 390:
2x − 3 � 0 Set up an inequality
- Page 391 and 392:
Solve. 10.1 Practice - Function Not
- Page 393 and 394:
10.2 Functions - Operations on Func
- Page 395 and 396:
(x − 5)(x +1) (x − 5) Divide ou
- Page 397 and 398:
We can also evaluate a composition
- Page 399 and 400:
23) f(x) = x 2 − 5x g(x) = x + 5
- Page 401 and 402:
10.3 Functions - Inverse Functions
- Page 403 and 404:
(3x +6)(3 − 4x) 3 − 4x (4x+8)(3
- Page 405 and 406:
10.3 Practice - Inverse Functions S
- Page 407 and 408:
Example 530. 8 3x = 32 Rewrite 8 as
- Page 409 and 410:
10.4 Practice - Exponential Functio
- Page 411 and 412:
log3x =7 Identify base, 3, answer,
- Page 413 and 414:
10.5 Practice - Logarithmic Functio
- Page 415 and 416:
A = 25000(1.01625) 20 Evaluate expo
- Page 417 and 418:
The variable e is a constant simila
- Page 419 and 420:
j. All of the above compounded cont
- Page 421 and 422:
Using the diagram at right, find ea
- Page 423 and 424:
10.7 Practice - Trigonometric Funct
- Page 425 and 426:
21) 23) 25) 27) A B A 5 38 ◦ x x
- Page 427 and 428:
37) 39) A A 37.1 ◦ C x x C 13.1 4
- Page 429 and 430:
θ 17 From angle θ the given sides
- Page 431 and 432:
function to find the missing angle
- Page 433 and 434:
Find the measure of each angle indi
- Page 435 and 436:
27) 29) 14 A A θ C 15 7 C 14 θ B
- Page 437 and 438:
437
- Page 439 and 440:
7) 5 4 8) 4 3 9) 3 2 10) 8 3 11) 5
- Page 441 and 442:
54) 60v − 7 55) − 3x + 8x 2 56)
- Page 443 and 444:
45) 12 46) All real numbers 47) No
- Page 445 and 446:
15) wx 3 = 1458 16) h = 1.5 j 17) a
- Page 447 and 448:
1) B(4, − 3) C(1, 2) D( − 1, 4)
- Page 449 and 450:
1) y = 2x +5 2) y = − 6x +4 3) y
- Page 451 and 452:
23) x =4 24) y − 4 = 7 (x − 1)
- Page 453 and 454:
25) 5�x
- Page 455 and 456:
1) ( − 2, 4) 2) (2,4) 3) No solut
- Page 457 and 458:
27) 56, 144 28) 1.5, 3.5 29) 30 30)
- Page 459 and 460:
42) 1.2 × 10 6 5.4 1) 3 2) 7 3)
- Page 461 and 462:
5) 2x 3 + 4x 2 + x 2 6) 5p3 4 +4p2
- Page 463 and 464:
7) (b +8)(b + 4) 8) (b − 10)(b
- Page 465 and 466:
11) n(n − 1) 12) (5x +3)(x − 5)
- Page 467 and 468:
5) 3x2 2 6) 5p 2 7) 5m 8) 7 10 9) r
- Page 469 and 470:
7) 8) 5 24r 7x + 3y x 2 y 2 9) 15t+
- Page 471 and 472:
21) 0, 5 22) − 2, 5 3 23) 4,7 24)
- Page 473 and 474:
42) − 18xz 4x3yz3 � 4 8.3 1) 6
- Page 475 and 476:
16 3 √ + 4 5 √ 43 18) 19) 2 √
- Page 477 and 478:
8.8 1) 11 − 4i 2) − 4i 3) − 3
- Page 479 and 480:
√ √ 33) 4+i 39, 4 −i 39 34)
- Page 481 and 482:
9) ± 2, ± 4 10) 2,3, − 1 ±i 3
- Page 483 and 484:
1) 2) 3) 4) 5) 6) (-2,0) (0,-8) (-1
- Page 485 and 486:
11) 100 12) − 74 13) 1 5 14) 27 1
- Page 487 and 488:
10.5 1) 9 2 = 81 2) b −16 = a 3)
- Page 489:
21) 51.3 ◦ 22) 45 ◦ 23) 56.4