Table 1—Subject Demographicsn M:F Age M/E a(Mean ± SD) (Mean ± SD)Not Re-Entrained 12 5:7 28.1 ± 1.7 53.3 ± 5.1Partially Re-Entrained 21 9:12 24.0 ± 1.1 54.5 ± 1.6Completely Re-Entrained 6 2:4 25.2 ± 2.7 54.7 ± 4.5aMorningness-Eveningness score 25dian rhythms of most of the subjects to a point near the <strong>com</strong>promisephase position after two blocks of night shifts separated byan intervening weekend off. 20,21 Here we present mood, fatigue,and performance data from these 2 studies. Our primary objectivewas to <strong>com</strong>pare mood, fatigue, and performance for subjectswho were <strong>com</strong>pletely, partially, or not re-entrained to thenight work, day sleep schedule. We hypothesized that subjectswho achieved partial re-entrainment (circadian phase close tothe target <strong>com</strong>promise phase position) would show improvementsduring the night shifts relative to subjects that were notre-entrained, and would be similar to those who achieved <strong>com</strong>pletere-entrainment to the night work, day sleep schedule. Asecondary objective was to <strong>com</strong>pare mood, fatigue, and performancemeasured during night shifts to daytime levels. Wehypothesized that subjects achieving either partial or <strong>com</strong>pletere-entrainment would rate themselves and perform at close todaytime levels, while not re-entrained subjects would showmore night shift impairment, relative to daytime levels.METHODS & DESIGNThe last 2 studies in this series were named #3 20 and #4 21 intheir titles. For clarity, here we refer to them as studies A 20 andB, 21 respectively. Each was a between-subjects design with acontrol and experimental group. In all groups there were largeindividual differences in the final circadian phase position atthe end of the series of night shifts and days off. The presentanalyses pool data from these 2 studies and are based on finalcircadian phase position independent of group assignment (experimentalor control) or study. Subjects were divided into 3groups (not re-entrained, partially re-entrained, <strong>com</strong>pletely reentrained),as explained below.SubjectsTwenty-four subjects <strong>com</strong>pleted study A, and 19 subjects<strong>com</strong>pleted study B. Four subjects <strong>com</strong>pleted both studies, andthe data for these subjects’ participation was included only once,leaving 39 subjects in the analyses. The decision of which datato include for these 4 subjects was made by the correspondingauthor before data analyses began on the basis of the finalDLMO for each subject, in an attempt to make the sample sizesof the 3 groups more similar. The age, sex, and morningnesseveningnessscore 25 for the 3 groups were similar (Table 1).Subjects had a BMI < 30 kg/m 2 , were nonsmokers, habituallydrank < 300 mg caffeine/day, and did not take prescriptionmedication, except for 9 female subjects who used hormonalcontraceptives. A urine toxicology screen when beginning thestudy verified that subjects did not use recreational drugs. Inthe month preceding the study, subjects had not worked nightshifts or crossed more than 3 time zones. These studies were approvedby the Rush University Medical Center Institutional ReviewBoard. All subjects provided written informed consent.Baseline Sleep and Morning Light ScheduleDuring a 15 day baseline period, all subjects maintained aregular sleep/wake schedule. Subjects remained in bed from23:00-7:00 on weeknights, while on weekends bedtime wasbetween 23:00-00:00, with wake time between 7:00-8:00. Subjectswere required to go outside for ≥ 15 minutes of light exposureevery day between 8:00-9:00. A baseline circadian phaseassessment (described below) was conducted on days 15-16.After this phase assessment subjects returned to the baselineschedule of sleep/wake and light exposure for an additional 6days before <strong>com</strong>ing to the lab for the first night shift.Study InterventionsBeginning on study day 23, subjects came to the lab for a seriesof night shifts (23:00 to 07:00). Subjects in study A underwent 3night shifts, 2 days off, and 4 more night shifts (Figure 1). Subjectsin study B underwent 3 night shifts, 2 days off, 5 more nightshifts, and 2 more days off. On each night shift the experimentalsubjects were exposed to 15-min intermittent bright light pulsesfrom light boxes containing fluorescent lamps (5095K, Sun Ray,Sun Box Company, Inc), timed to delay circadian rhythms. Instudy A, the experimental group received 5 light pulses. The firstpulse began at 00:45 and the last pulse ended at 5:00. In studyB, the experimental group received 4 light pulses. The first pulsebegan at 00:45 and the last pulse ended at 4:00. The light pulsefrom 4:45 to 5:00 during each night shift in study B was omittedbecause the final phase assessment in study A showed that someexperimental subjects delayed slightly more than desired, into the<strong>com</strong>plete re-entrainment category. At a typical distance and angleof gaze, the illuminance of the bright light pulses was ~ 4100 lux,the irradiance was ~ 1200 μW/cm 2 , and the photon density was ~3.1 x 10 15 photons/cm 2 /second. Light pulses were separated by 45minutes of room light ( < 50 Lux, 4100K). Subjects in the controlgroups remained in this room light throughout the night shifts.Experimental subjects were required to remain in bed duringscheduled times after night shifts and on weekends off (blackbars in top panel of Figure 1). Scheduled sleep was from 8:30to 15:30 on days 23-24 and 28-31, from 8:30-13:30 after thelast night shift before a weekend off (days 25 and 32), and from3:00-12:00 on days off (days 26, 27, 33, 34). Experimental subjectswere required to go outside for ≥ 15 minutes of light exposurewithin the first 2 h after awakening starting on day 23. Thepurpose of this “light brake” was to keep their circadian clocksfrom delaying past the target <strong>com</strong>promise phase position. Sleepand light exposure for control subjects were unrestricted.Subjects wore sunglasses at all times when outside duringdaylight hours. Control subjects wore light sunglasses (rangingfrom 0% transmission at 400 nm to about 55% at 650 nm).Experimental subjects wore darker sunglasses (ranging from0% at 400 nm to about 25% at 650 nm) that more strongly attenuatedshort wavelength light. The spectral transmission ofboth lenses have been published. 18 The primary purpose of thesunglasses was to attenuate phase-advancing outdoor light exposureduring the travel home time after night shifts for theexperimental groups.SLEEP, Vol. 32, No. 11, 2009 1482Circadian Phase, Mood, Fatigue and Performance—Smith et al
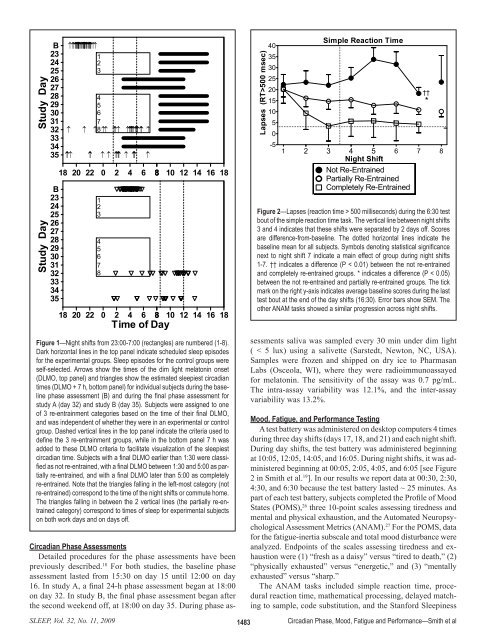
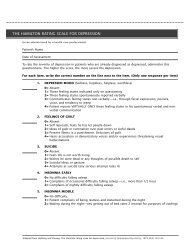
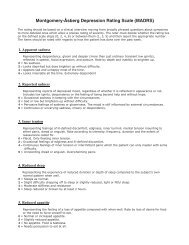
Study DayStudy DayB23242526272829303132333435B23242526272829303132333435↑↑↑↑↑↑↑↑↑1234567↑8↑↑↑↑↑ ↑↑ ↑↑↑↑18 20 22 0 2 4 6 8 10 12 14 16 181234567818 20 22 0 2 4 6 8 10 12 14 16 18Time of DayFigure 1—Night shifts from 23:00-7:00 (rectangles) are numbered (1-8).Dark horizontal lines in the top panel indicate scheduled sleep episodesfor the experimental groups. Sleep episodes for the control groups wereself-selected. Arrows show the times of the dim light melatonin onset(DLMO, top panel) and triangles show the estimated sleepiest circadiantimes (DLMO + 7 h, bottom panel) for individual subjects during the baselinephase assessment (B) and during the final phase assessment forstudy A (day 32) and study B (day 35). Subjects were assigned to oneof 3 re-entrainment categories based on the time of their final DLMO,and was independent of whether they were in an experimental or controlgroup. Dashed vertical lines in the top panel indicate the criteria used todefine the 3 re-entrainment groups, while in the bottom panel 7 h wasadded to these DLMO criteria to facilitate visualization of the sleepiestcircadian time. Subjects with a final DLMO earlier than 1:30 were classifiedas not re-entrained, with a final DLMO between 1:30 and 5:00 as partiallyre-entrained, and with a final DLMO later than 5:00 as <strong>com</strong>pletelyre-entrained. Note that the triangles falling in the left-most category (notre-entrained) correspond to the time of the night shifts or <strong>com</strong>mute home.The triangles falling in between the 2 vertical lines (the partially re-entrainedcategory) correspond to times of sleep for experimental subjectson both work days and on days off.↑Lapses (RT>500 msec)4035302520151050-5Simple Reaction Time1 2 3 4 5 6 7 8Night ShiftNot Re-EntrainedPartially Re-EntrainedCompletely Re-EntrainedCircadian Phase AssessmentsDetailed procedures for the phase assessments have beenpreviously described. 18 For both studies, the baseline phaseassessment lasted from 15:30 on day 15 until 12:00 on day16. In study A, a final 24-h phase assessment began at 18:00on day 32. In study B, the final phase assessment began afterthe second weekend off, at 18:00 on day 35. During phase assessmentssaliva was sampled every 30 min under dim light( < 5 lux) using a salivette (Sarstedt, Newton, NC, USA).Samples were frozen and shipped on dry ice to PharmasanLabs (Osceola, WI), where they were radioimmunoassayedfor melatonin. The sensitivity of the assay was 0.7 pg/mL.The intra-assay variability was 12.1%, and the inter-assayvariability was 13.2%.Mood, Fatigue, and Performance TestingA test battery was administered on desktop <strong>com</strong>puters 4 timesduring three day shifts (days 17, 18, and 21) and each night shift.During day shifts, the test battery was administered beginningat 10:05, 12:05, 14:05, and 16:05. During night shifts, it was administeredbeginning at 00:05, 2:05, 4:05, and 6:05 [see Figure2 in Smith et al. 19 ]. In our results we report data at 00:30, 2:30,4:30, and 6:30 because the test battery lasted ~ 25 minutes. Aspart of each test battery, subjects <strong>com</strong>pleted the Profile of MoodStates (POMS), 26 three 10-point scales assessing tiredness andmental and physical exhaustion, and the Automated NeuropsychologicalAssessment Metrics (ANAM). 27 For the POMS, datafor the fatigue-inertia subscale and total mood disturbance wereanalyzed. Endpoints of the scales assessing tiredness and exhaustionwere (1) “fresh as a daisy” versus “tired to death,” (2)“physically exhausted” versus “energetic,” and (3) “mentallyexhausted” versus “sharp.”The ANAM tasks included simple reaction time, proceduralreaction time, mathematical processing, delayed matchingto sample, code substitution, and the Stanford Sleepiness††*Figure 2—Lapses (reaction time > 500 milliseconds) during the 6:30 testbout of the simple reaction time task. The vertical line between night shifts3 and 4 indicates that these shifts were separated by 2 days off. Scoresare difference-from-baseline. The dotted horizontal lines indicate thebaseline mean for all subjects. Symbols denoting statistical significancenext to night shift 7 indicate a main effect of group during night shifts1-7. †† indicates a difference (P < 0.01) between the not re-entrainedand <strong>com</strong>pletely re-entrained groups. * indicates a difference (P < 0.05)between the not re-entrained and partially re-entrained groups. The tickmark on the right y-axis indicates average baseline scores during the lasttest bout at the end of the day shifts (16:30). Error bars show SEM. Theother ANAM tasks showed a similar progression across night shifts.SLEEP, Vol. 32, No. 11, 2009 1483Circadian Phase, Mood, Fatigue and Performance—Smith et al
- Page 1 and 2:
Practice Management Tips ForSHIFT W
- Page 3 and 4:
Patient QuestionnaireDo you often f
- Page 5 and 6:
Sleep/Wake LogIn bedOut of bedLight
- Page 7 and 8:
PHQ-9 QUICK DEPRESSION ASSESSMENTFo
- Page 9 and 10:
Insomnia Severity IndexPlease answe
- Page 11 and 12:
Take-Away PointsSHIFT WORK DISORDER
- Page 13 and 14:
SHIFT WORKDISORDERBright Light Ther
- Page 40 and 41:
PrimarycareScreeningfor depressioni
- Page 42 and 43:
PrimarycareThescreening questionnai
- Page 44 and 45:
Shift-work disorderContents and Fac
- Page 46 and 47:
Shift-work disorderThe diagnosis of
- Page 48 and 49:
Shift-work disorderas heightened le
- Page 50 and 51:
Shift-work disorderFigure 1 Risk ra
- Page 52 and 53:
Shift-work disorderare not function
- Page 54 and 55:
The characterization andpathology o
- Page 56 and 57:
Shift-work disorderFigure 2 Sleep/w
- Page 58 and 59:
Shift-work disorderFigure 3 Blood p
- Page 60 and 61:
Recognition of shift-workdisorder i
- Page 62 and 63:
Shift-work disorderThe timing of sh
- Page 64 and 65:
Shift-work disorderthe other potent
- Page 66 and 67:
Managing the patient withshift-work
- Page 68 and 69:
Shift-work disorderFigure 3 Optimal
- Page 70 and 71:
Shift-work disorderfor a motor vehi
- Page 72 and 73:
Shift-work disordermoderate caffein
- Page 74 and 75:
Supplement toAvailable at jfponline
- Page 76 and 77:
Armodafinil for Treatment of Excess
- Page 78 and 79:
Armodafinil for Treatment of Excess
- Page 80 and 81:
Armodafinil for Treatment of Excess
- Page 82 and 83:
Armodafinil for Treatment of Excess
- Page 84 and 85:
Armodafinil for Treatment of Excess
- Page 86 and 87:
Armodafinil for Treatment of Excess
- Page 88 and 89:
Armodafinil for Treatment of Excess
- Page 90 and 91:
Armodafinil for Treatment of Excess
- Page 92 and 93: Armodafinil for Treatment of Excess
- Page 94 and 95: Armodafinil for Treatment of Excess
- Page 96 and 97: Armodafinil for Treatment of Excess
- Page 98 and 99: The Epidemiology and Diagnosis of I
- Page 100 and 101: The Epidemiology and Diagnosis of I
- Page 102 and 103: The Epidemiology and Diagnosis of I
- Page 120 and 121: CIRCADIAN RHYTHM SLEEP DISORDERSPra
- Page 122 and 123: Table 2— AASM Levels of Recommend
- Page 124 and 125: 3.2.1.1 Both the Morningness-Evenin
- Page 126 and 127: Five studies used one of the newer
- Page 128 and 129: as an indicator of phase in sighted
- Page 130 and 131: 4.4 Advanced Sleep Phase DisorderBe
- Page 132 and 133: 45. Walsh, JK, Randazzo, AC, Stone,
- Page 134: 123. Van Someren, EJ, Kessler, A, M
- Page 144 and 145: Scale. 28 The simple reaction time
- Page 146 and 147: Median RT (msec)1600A14001200100080
- Page 148 and 149: 10Mentally AExhaustedSharpScore8642
- Page 150 and 151: Current Treatment Options in Neurol
- Page 152 and 153: 398 Sleep Disordersand sleep loss,
- Page 154 and 155: 400 Sleep DisordersTable 1. Treatme
- Page 156 and 157: 402 Sleep DisordersStandard dosageC
- Page 158 and 159: 404 Sleep DisordersStandard procedu
- Page 160 and 161: 406 Sleep DisordersCaffeineMelatoni
- Page 162 and 163: 408 Sleep DisordersWake-promoting a
- Page 164 and 165: 410 Sleep Disordersnight shift: ada