FEDERATION OF EURO-ASIAN STOCK EXCHANGES ANNUAL REPORT JUNE 2010ISTANBUL STOCK EXCHANGEECONOMIC AND POLITICAL DEVELOPMENTSEconomic and Political EnvironmentThe recent subprime mortgage crisis andfinancial crisis, increasing unemployementincreased the threats of a recession in theworld economy. The crisis in the worldeconomy has an impact on Turkish economy.But Turkish economy has not been affected bythe global crisis severely due to Turkey hasimproved its macroeconomic situation with adetermined fiscal discipline, prudent monetarypolicy, political stability, social security reform,large privatizations and structural reforms.Turkey has implemented a range of economic,political and social reforms in an effort to meetEU requirements. The ongoing process of EUaccession and the signing of a new stand-byagreement with the IMF covering the period of2005-2008 have created two strong anchorsfor increasing Turkey’s growth potential andimproving a better functioning marketeconomy.Rehabilitating the business environment,diminishing unrecorded economy,strengthening financial system, promotingcommunication and information technologiesare among the targets of the economymanagement for the upcoming years in orderto lift Turkey onto a significantly higher growthtrajectory.Economic PerformanceFollowing the GNP growth rate of 4.6%achieved in 2007, the Turkish economy grewby 3% in the first three quarters of 2008. Theconsumption expenditure of residenthouseholds grew by 3.3% in the same periodof 2008. The investment expenditures of thepublic sector grew by 1.2% and the privatesector investment expenditures grew by 0.8%in the same period of 2008.In the January-November period of 2008,exports and imports reached US$ 124.3 billionand US$ 190.5 billion, respectively, exportsregistering an increase of 27.4% and importsregistering an increase of 23.8% compared tothe same period of 2007. Accordingly, the rateof imports covered by exports stood at 65.2%as of November 2008.As of December 2008, the year-on-yearconsumer price index increased by 10.06%and the year-on-year producer price indexincreased by 8.11% compared to the samemonth of the previous year.The consolidated budget registered a deficit ofYTL 4.9 billion as of October 2008 bringing theprimary surplus to YTL 38.5 billion. Totalrevenues increased by 12.7% to YTL 175.8billion and total expenditures increased by7.4% to YTL 180.7 billion in the January-October period 2008 compared to the sameperiod of 2007.The gross privatization revenues in 2008 wererecorded as US$ 6.3 billion. The breakdown ofthe privatization revenues is as follows; US$ 2billion as block sale, US$ 1.9 billion as publicoffering and US$ 2.3 billion as asset sale.In 2008, the ISE National-100 Index, the mainindex on the Istanbul Stock Exchange, showeda decrease of 51.6% in YTL terms and 63.2%in US$ terms as compared to the values at theend of 2008. The stock market yearly totaltraded value decreased to US$ 261.3 billion by13.2% in US$ terms in 2008 compared to2007. The average daily traded value ofequities stood at US$ 1.04 billion in 2008.The market capitalization of 317 ISE tradedcompanies decreased to a level of US$ 119.7billion at the end of 2008 from US$ 290 billionat the end of 2007. Nine ETFs (ExchangeTraded Fund) are traded on the ISE ETFsMarket in 2008.The net equity investments within the free floatof the ISE traded companies by foreignportfolio investors has been registered ataround US$ 27.5 billion at the end of 2008representing 67.5% of the total value stocks incustody.The turnover in public debt securitiestransacted on the Outright Purchasesand Sales Market decreased by 14.2% toUS$ 239.4 billion in 2008 compared to 2007.The Repo/Reverse Repo Market turnoverincreased by 14.1% to US$ 2,274 billion in thesame period. The average daily traded valuein Outright Purchases and Sales Market andthe Repo/Reverse Repo Market, stood at US$10 billion at the end of 2008.In 2008, two companies and one ExchangeTraded Fund (ETFs) offered their stocks for thefirst time to public and started to be traded onthe ISE Stock Market. The amount of fundsraised by the IPOs of two companies wasUS$ 1.9 billion.All brokerage houses (104 brokerage houses)have been provided with remote access to thestock market trading system. In 2008, thenumber of orders sent by members via Ex-API(Express Application Programming Interface)terminals reached 92% of all orders. Tradingon the Bonds and Bills Market is alreadycarried out remotely.** Information provided by the Istanbul Stock ExchangeKey Information ContactsCapital Markets Board of Turkey www.cmb.gov.trISE Settlement and Custody Bank Inc.(Takasbank) www.takasbank.com.trCentral Registry Agency Inc. www.mkk.com.trThe Association of Capital Market Intermediary Institutions of Turkey www.tspakb.org.trThe Turkish Derivatives Exchange (TurkDEX) www.turkdex.org.trREAL GDP(TRY millions)CONSUMER PRICES (% CHANGE PA; AV)(%)12010.510010.09.5809.0608.58.0407.5207.06.506.02005 2006 2007 2008 2009 2010 2005 2006 2007 2008 2009 2010PAGE 96
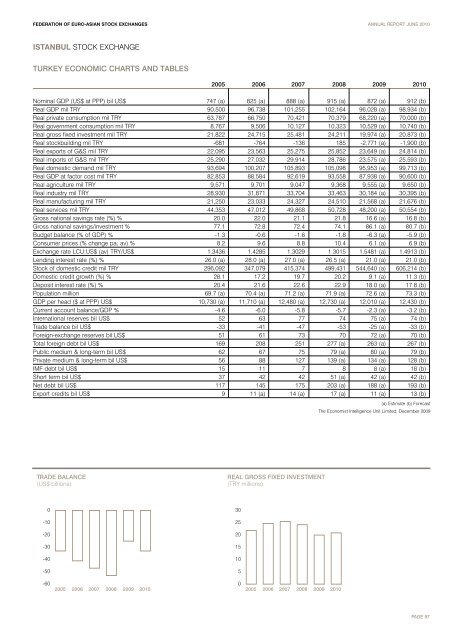
FEDERATION OF EURO-ASIAN STOCK EXCHANGES ANNUAL REPORT JUNE 2010ISTANBUL STOCK EXCHANGETURKEY ECONOMIC CHARTS AND TABLES2005 2006 2007 2008 2009 2010Nominal GDP (US$ at PPP) bil US$ 747 (a) 825 (a) 888 (a) 915 (a) 872 (a) 912 (b)Real GDP mil TRY 90,500 96,738 101,255 102,164 96,028 (a) 98,934 (b)Real private consumption mil TRY 63,787 66,750 70,421 70,379 68,220 (a) 70,000 (b)Real government consumption mil TRY 8,767 9,506 10,127 10,323 10,529 (a) 10,740 (b)Real gross fixed investment mil TRY 21,822 24,715 25,481 24,211 19,974 (a) 20,873 (b)Real stockbuilding mil TRY -681 -764 -136 185 -2,771 (a) -1,900 (b)Real exports of G&S mil TRY 22,095 23,563 25,275 25,852 23,649 (a) 24,814 (b)Real imports of G&S mil TRY 25,290 27,032 29,914 28,786 23,575 (a) 25,593 (b)Real domestic demand mil TRY 93,694 100,207 105,893 105,098 95,953 (a) 99,713 (b)Real GDP at factor cost mil TRY 82,853 88,584 92,619 93,558 87,938 (a) 90,600 (b)Real agriculture mil TRY 9,571 9,701 9,047 9,368 9,555 (a) 9,650 (b)Real industry mil TRY 28,930 31,871 33,704 33,463 30,184 (a) 30,395 (b)Real manufacturing mil TRY 21,250 23,033 24,327 24,510 21,568 (a) 21,676 (b)Real services mil TRY 44,353 47,012 49,868 50,728 48,200 (a) 50,554 (b)Gross national savings rate (%) % 20.0 22.0 21.1 21.8 16.6 (a) 16.8 (b)Gross national savings/investment % 77.1 72.8 72.4 74.1 86.1 (a) 80.7 (b)Budget balance (% of GDP) % -1.3 -0.6 -1.6 -1.8 -6.3 (a) -5.9 (b)Consumer prices (% change pa; av) % 8.2 9.6 8.8 10.4 6.1 (a) 6.9 (b)Exchange rate LCU:US$ (av) TRY/US$ 1.3436 1.4285 1.3029 1.3015 1.5481 (a) 1.4913 (b)Lending interest rate (%) % 26.0 (a) 28.0 (a) 27.0 (a) 26.5 (a) 21.0 (a) 21.0 (b)Stock of domestic credit mil TRY 296,092 347,079 415,374 499,431 544,640 (a) 606,214 (b)Domestic credit growth (%) % 28.1 17.2 19.7 20.2 9.1 (a) 11.3 (b)Deposit interest rate (%) % 20.4 21.6 22.6 22.9 18.0 (a) 17.8 (b)Population million 69.7 (a) 70.4 (a) 71.2 (a) 71.9 (a) 72.6 (a) 73.3 (b)GDP per head ($ at PPP) US$ 10,730 (a) 11,710 (a) 12,480 (a) 12,730 (a) 12,010 (a) 12,430 (b)Current account balance/GDP % -4.6 -6.0 -5.8 -5.7 -2.3 (a) -3.2 (b)International reserves bil US$ 52 63 77 74 75 (a) 74 (b)Trade balance bil US$ -33 -41 -47 -53 -25 (a) -33 (b)Foreign-exchange reserves bil US$ 51 61 73 70 72 (a) 70 (b)Total foreign debt bil US$ 169 208 251 277 (a) 263 (a) 267 (b)Public medium & long-term bil US$ 62 67 75 79 (a) 80 (a) 79 (b)Private medium & long-term bil US$ 56 88 127 139 (a) 134 (a) 128 (b)IMF debt bil US$ 15 11 7 8 8 (a) 18 (b)Short term bil US$ 37 42 42 51 (a) 42 (a) 42 (b)Net debt bil US$ 117 145 175 203 (a) 188 (a) 193 (b)Export credits bil US$ 9 11 (a) 14 (a) 17 (a) 11 (a) 13 (b)(a) Estimate (b) ForecastThe Economist Intelligence Unit Limited, December 2009TRADE BALANCE(US$ billions)REAL GROSS FIXED INVESTMENT(TRY millions)0-10-20-30-40-5030252015105-602005 2006 2007 2008 2009 201002005 2006 2007 2008 2009 2010PAGE 97