

Download - FEAS
Download - FEAS
Download - FEAS
- No tags were found...

You also want an ePaper? Increase the reach of your titles
YUMPU automatically turns print PDFs into web optimized ePapers that Google loves.
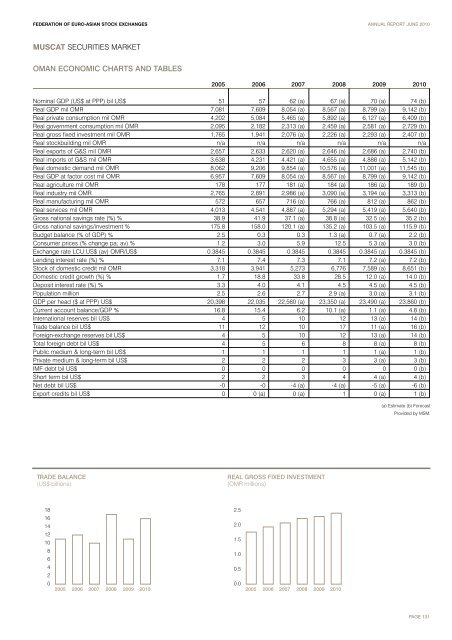
FEDERATION OF EURO-ASIAN STOCK EXCHANGES ANNUAL REPORT JUNE 2010MUSCAT SECURITIES MARKETOMAN ECONOMIC CHARTS AND TABLES2005 2006 2007 2008 2009 2010Nominal GDP (US$ at PPP) bil US$ 51 57 62 (a) 67 (a) 70 (a) 74 (b)Real GDP mil OMR 7,081 7,609 8,054 (a) 8,567 (a) 8,799 (a) 9,142 (b)Real private consumption mil OMR 4,202 5,084 5,465 (a) 5,892 (a) 6,127 (a) 6,409 (b)Real government consumption mil OMR 2,095 2,182 2,313 (a) 2,459 (a) 2,581 (a) 2,729 (b)Real gross fixed investment mil OMR 1,765 1,941 2,076 (a) 2,226 (a) 2,293 (a) 2,407 (b)Real stockbuilding mil OMR n/a n/a n/a n/a n/a n/aReal exports of G&S mil OMR 2,657 2,633 2,620 (a) 2,646 (a) 2,686 (a) 2,740 (b)Real imports of G&S mil OMR 3,638 4,231 4,421 (a) 4,655 (a) 4,888 (a) 5,142 (b)Real domestic demand mil OMR 8,062 9,206 9,854 (a) 10,576 (a) 11,001 (a) 11,545 (b)Real GDP at factor cost mil OMR 6,957 7,609 8,054 (a) 8,567 (a) 8,799 (a) 9,142 (b)Real agriculture mil OMR 178 177 181 (a) 184 (a) 186 (a) 189 (b)Real industry mil OMR 2,765 2,891 2,986 (a) 3,090 (a) 3,194 (a) 3,313 (b)Real manufacturing mil OMR 572 657 716 (a) 766 (a) 812 (a) 862 (b)Real services mil OMR 4,013 4,541 4,887 (a) 5,294 (a) 5,419 (a) 5,640 (b)Gross national savings rate (%) % 38.9 41.9 37.1 (a) 38.8 (a) 32.5 (a) 35.2 (b)Gross national savings/investment % 175.8 158.0 120.1 (a) 135.2 (a) 103.5 (a) 115.9 (b)Budget balance (% of GDP) % 2.5 0.3 0.3 1.3 (a) 0.7 (a) 2.2 (b)Consumer prices (% change pa; av) % 1.2 3.0 5.9 12.5 5.3 (a) 3.0 (b)Exchange rate LCU:US$ (av) OMR/US$ 0.3845 0.3845 0.3845 0.3845 0.3845 (a) 0.3845 (b)Lending interest rate (%) % 7.1 7.4 7.3 7.1 7.2 (a) 7.2 (b)Stock of domestic credit mil OMR 3,318 3,941 5,273 6,776 7,589 (a) 8,651 (b)Domestic credit growth (%) % 1.7 18.8 33.8 28.5 12.0 (a) 14.0 (b)Deposit interest rate (%) % 3.3 4.0 4.1 4.5 4.5 (a) 4.5 (b)Population million 2.5 2.6 2.7 2.9 (a) 3.0 (a) 3.1 (b)GDP per head ($ at PPP) US$ 20,398 22,035 22,560 (a) 23,350 (a) 23,490 (a) 23,860 (b)Current account balance/GDP % 16.8 15.4 6.2 10.1 (a) 1.1 (a) 4.8 (b)International reserves bil US$ 4 5 10 12 13 (a) 14 (b)Trade balance bil US$ 11 12 10 17 11 (a) 16 (b)Foreign-exchange reserves bil US$ 4 5 10 12 13 (a) 14 (b)Total foreign debt bil US$ 4 5 6 8 8 (a) 8 (b)Public medium & long-term bil US$ 1 1 1 1 1 (a) 1 (b)Private medium & long-term bil US$ 2 2 2 3 3 (a) 3 (b)IMF debt bil US$ 0 0 0 0 0 0 (b)Short term bil US$ 2 2 3 4 4 (a) 4 (b)Net debt bil US$ -0 -0 -4 (a) -4 (a) -5 (a) -6 (b)Export credits bil US$ 0 0 (a) 0 (a) 1 0 (a) 1 (b)(a) Estimate (b) ForecastProvided by MSM.TRADE BALANCE(US$ billions)REAL GROSS FIXED INVESTMENT(OMR millions)1816141210864202005 2006 2007 2008 2009 20102.52.01.51.00.50.02005 2006 2007 2008 2009 2010PAGE 131


