FEDERATION OF EURO-ASIAN STOCK EXCHANGES ANNUAL REPORT JUNE 2010BAHRAIN STOCK EXCHANGERasheed Mohammed Al-MarajChairmanDuring 2008, BSE implemented its strategicplan in which it upgraded its technicalcapabilities, allowing the Exchange tolaunch its online trading service to brokers.The global financial crisis that began with themortgage crisis in the U.S. has severelyaffected the performance of bourses andfinancial markets worldwide, triggering sharpdeclines in indices compared to the gainsrecorded in the previous years.The indices of GCC and Arab financialmarkets along with Bahrain Stock Exchangewere apparently affected by the crisis toreflect the interrelation between financialmarkets worldwide.The performance of Bahrain All Share Indexin 2008 was not any different than the otherindices of bourses, Arab and financialmarkets. The index posted negative growthof 34.52% during 2008 compared to 2007although the trading activity wasunprecedented in terms of the value andvolume of shares traded, and the number oftransactions executed throughout the year.During 2008, BSE implemented its strategicplan that was approved in 2007 in which itupgraded its technical capabilities, allowingthe Exchange to launch its online tradingservice to brokers. Moreover, BSE developedthe Exchange’s Settlement and CentralDepositary services with the aim offacilitating investors’ transactions andallowing them to perform most of theirtransactions through the Exchange’swebsite. In implementing BSE’s strategy,BSE in cooperation with the Central Bank ofBahrain listed several mutual funds on theExchange during the year.Shaikh Salman bin Hamad Al Khalifa, DeputySupreme Commander and Chairman of theEconomic Board (EDB), honored the signingceremony held in Singapore by hispresence, where a consultancy agreementbetween BSE and Singapore Exchange(SGX) was signed. The MoU mainly aims tofoster a closer relationship and developchannels of information exchange in theareas of operations, regulatory framework,and the equities products traded on therespective markets.In addition, BSE has taken a strategic movetowards developing the Exchange by signinga consultancy agreement with SingaporeExchange (SGX). According to thisconsultancy agreement, SGX will providedetailed recommendations to BSE for thepurpose of enhancing BSE’scompetitiveness both regionally andinternationally.In regards to BSE’s relocation to BahrainFinancial Harbor, the project’s manager hasbeen appointed and BSE’s offices are nearcompletion. The Exchange is expected tofully commence its operations and provideits services from its new premises in thesecond half of 2009.BSE’s financial results for the year 2008, asincluded in the budget of this report, showedthat the Exchange has reported positiveresults for its third consecutive year. Itrecorded a surplus of BD 1,284,338compared with BD 901,334 in 2007, postinga growth of 42.49%. The accumulatedsurplus also increased to reach BD3,950,112 compared to BD 2,665,774 in2007 recording a growth of 48.17%.On behalf of the members of the Board ofDirectors of BSE and BSE’s staff, I would liketo express my thanks and gratitude to HisMajesty King Hamad bin Isa bin Salman AlKhalifa, King of the Kingdom of Bahrain andHis Highness Shaikh Khalifa bin Salman AlKhalifa, the Prime Minister, and His HighnessShaikh Salman bin Hamad Al Khalifa, theCrown Prince and Deputy SupremeCommander for their guidance andcontinuous support of BSE.I would also like to extend my thanks to themembers of BSE's Board of Directors fortheir efforts in developing the BSE during theprevious years. I would also like to thankBSE’s management and staff for their hardwork during the year, hoping that such effortswill continue to further develop theExchange.HISTORY AND DEVELOPMENTIt was back in 1920 that the first branch of acommercial bank, Standard Chartered Bank,formerly known as Eastern Bank, opened itsdoors in Bahrain, the first to do so in theregion in order to facilitate the businesscommunity at that time. By 1957, Bahrainhad its first public shareholding company–the National Bank of Bahrain. However, itwas not until the late 1970s and early 1980sthat Bahrain realized there was a growingneed for an organized stock market, due tothe growth provided by the oil price boom inthe region.As a result, the Government, in cooperationwith the International Finance Corporation(IFC), prepared a feasibility studyhighlighting the importance of establishingan official stock market in Bahrain. In 1987,Bahrain Stock Exchange was establishedfollowing the issuance of Amiri Decree No.4, and officially commenced operations on17th June 1989.FUTURE OUTLOOKIn the year 2009, the BSE will continue itsefforts to attract more local, regional, andinternational mutual funds despite the globalfinancial crisis. The BSE will also seek morecooperation with stock exchangesworldwide, with the aim of exchanginginformation and expertise. The BSE will alsocontinue to attract more listed companies,both local and international.PAGE 50
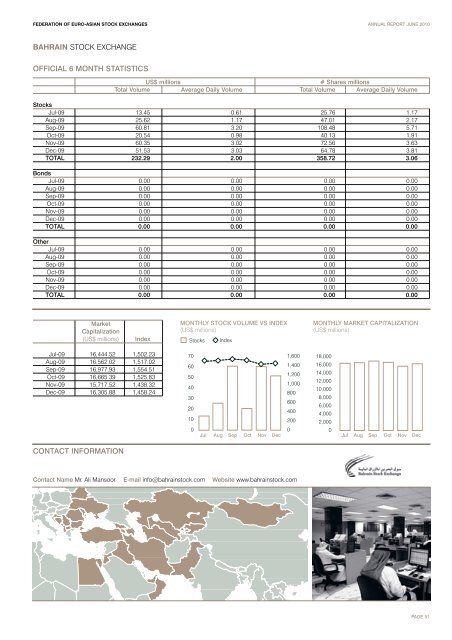
FEDERATION OF EURO-ASIAN STOCK EXCHANGES ANNUAL REPORT JUNE 2010BAHRAIN STOCK EXCHANGEOFFICIAL 6 MONTH STATISTICSUS$ millions# Shares millionsTotal Volume Average Daily Volume Total Volume Average Daily VolumeStocksJul-09 13.45 0.61 25.76 1.17Aug-09 25.62 1.17 47.01 2.17Sep-09 60.81 3.20 108.48 5.71Oct-09 20.54 0.98 40.13 1.91Nov-09 60.35 3.02 72.56 3.63Dec-09 51.53 3.03 64.78 3.81TOTAL 232.29 2.00 358.72 3.06BondsJul-09 0.00 0.00 0.00 0.00Aug-09 0.00 0.00 0.00 0.00Sep-09 0.00 0.00 0.00 0.00Oct-09 0.00 0.00 0.00 0.00Nov-09 0.00 0.00 0.00 0.00Dec-09 0.00 0.00 0.00 0.00TOTAL 0.00 0.00 0.00 0.00OtherJul-09 0.00 0.00 0.00 0.00Aug-09 0.00 0.00 0.00 0.00Sep-09 0.00 0.00 0.00 0.00Oct-09 0.00 0.00 0.00 0.00Nov-09 0.00 0.00 0.00 0.00Dec-09 0.00 0.00 0.00 0.00TOTAL 0.00 0.00 0.00 0.00MarketCapitalization(US$ millions)IndexMONTHLY STOCK VOLUME VS INDEX(US$ millions)StocksIndexMONTHLY MARKET CAPITALIZATION(US$ millions)Jul-09 16,444.52 1,502.23Aug-09 16,562.02 1,517.02Sep-09 16,977.93 1,554.51Oct-09 16,665.39 1,525.83Nov-09 15,717.52 1,438.32Dec-09 16,305.88 1,458.24CONTACT INFORMATION7060504030201001,600 18,0001,400 16,0001,200 14,0001,00012,00010,0008008,0006006,0004004,000200 2,00000Jul Aug Sep Oct Nov Dec Jul Aug Sep Oct Nov DecContact Name Mr. Ali Mansoor E-mail info@bahrainstock.com Website www.bahrainstock.comPAGE 51