FEDERATION OF EURO-ASIAN STOCK EXCHANGES ANNUAL REPORT JUNE 2010MACEDONIAN STOCK EXCHANGEECONOMIC AND POLITICAL DEVELOPMENTSEconomic and Political EnvironmentThe Internal Macedonian RevolutionaryOrganisation-Democratic Party of MacedonianNational Unity (VMRO-DPMNE) of the primeminister, Nikola Gruevski, is in a strong positionfollowing its sweeping victories in the presidentialand local authority elections, held in March andApril. With its latest triumphs, the party has builton its success in the parliamentary election ofJune 2008, when it was returned to power with anincreased majority. The incumbent president,Gjorge Ivanov, shares Mr Gruevski's conservative,nationalist outlook. It is therefore expected that hewill work closely with the prime minister–unlike hispredecessor, Branko Crvenkovski, who hadfrequent disagreements with the head ofgovernment.Relations with Greece are likely to remain in astate of flux following the change of governmentin Greece, after the opposition PanhellenicSocialist Movement (Pasok) defeated the rulingconservative party, New Democracy, in theelection on October 4th. The two countries are indispute over Macedonia's constitutional name,with Greece arguing that it implies a territorialclaim to its own northern province, which bearsthe same name. Macedonia has been seekinglegal redress from the International Court ofJustice (ICJ) in The Hague for Greece's decisionin 2008 to block its northern neighbour's NATOaccession. Greece has until January 20th 2010 torespond to Macedonia's detailed case before theICJ. The name dispute could also hinderMacedonia's EU integration, despite theEuropean Commission's recommendation, madein October, that the EU should open accessiontalks with Macedonia, which has been acandidate country since 2005. Macedonia ishoping to get a date from the EU in the next fewmonths for starting its membership negotiations,but Greece may decide to block the opening ofthe talks, unless a deal is agreed before then overMacedonia's name. The prospects for asettlement of the dispute may improve with a newgovernment in office in Greece. However, pastPasok governments showed no greaterwillingness to compromise on this issue than theoutgoing conservative administration, andMacedonia may yet have to consider changing itsconstitutional name in order to remove the lastremaining obstacle in the way of starting EUaccession talks.The government has repeatedly said that it doesnot wish to conclude a successor programme tothe three-year stand-by arrangement with the IMFthat came to an end in August 2008. Thegovernment's reluctance to turn to the Fund isbased on its determination to push ahead with taxbreaks and capital investment projects to counterthe economic downturn. In contrast, the IMF hasbeen urging greater fiscal discipline, in view ofMacedonia's external imbalances–although theFund's latest report, issued in October, hassounded a more positive note, calling for areduction in the budget deficit only in the mediumterm. However, the government may yet comeunder pressure to conclude a new arrangementwith the IMF, if the expected improvement in theexternal balances does not materialise.Economic PerformanceRecent data indicate that a recovery may now beunder way in Germany and France. However,estimated that the contraction in real GDP in theeuro zone will still amount to 4.1% in 2009. This,and a recession of a similar magnitude in Serbiaand other important export markets in southeasternEurope, is having a severe impact on theMacedonian economy. Forecasted that, after acontraction of an estimated 2.2% in real GDP in2009, the Macedonian economy will return togrowth in 2010. However, the rebound to bemodest to start with, as growth in privateconsumption will be limited by the lingeringimpact of the 2009 recession, including increasedunemployment, and government consumption willbe restricted by the need to rein in the budgetdeficit. Access to credit is also likely to remaindifficult, as local subsidiaries of foreign-ownedbanks continue to be affected by the aftermath ofthe global financial crisis. A weak recovery inMacedonia's euro area and Balkan exportmarkets is expected to hold back more robustgrowth until later in the forecast period. Weforecast that real GDP will increase by 1% in2010, before accelerating to 3% growth in 2011.Inflation has fallen sharply since it peaked in mid-2008, and has turned into deflation since June.The rapid deceleration has followed a drop inglobal oil prices, food price disinflation and, morerecently, a decline in domestic demand. TheNBRM appears determined to maintain thecurrent exchange-rate regime–under which thedenar is informally pegged to the euro–as part ofits monetary policy strategy in 2010-11. As anindication of its adherence to the de factoexchange rate, the bank raised its key repo ratefrom 7% to 9% in March 2009 in order to stabilisethe denar. Macedonia has stemmed the recentsharp decline in foreign reserves with moreborrowing since mid-2009. However, it may yetneed IMF assistance to protect the denar.Estimated that the current-account deficit willcontract to the equivalent of 9.7% of GDP in 2009,from a record 13% of GDP in 2008, followingweakening domestic demand and lowinternational oil prices. Although internationalenergy and commodity prices will strengthen tosome degree in the forecast period, we forecastthat the recovery in the euro zone will help toboost Macedonia's exports, and that it will alsocontribute to a rise in workers' remittances. Importdemand is expected to remain sluggish, asprivate consumption recovers slowly during theforecast period. We forecast that the annualcurrent-account deficits will narrow in 2010-11,averaging the equivalent of 7.7% of GDP. ** The Economist Intelligence Unit Limited, November 2009Key Information ContactsCentral Securities Depository www.cdhv.org.mkSecurities & Exchange Commission www.sec.gov.mkNational Bank of the Republic of Macedonia www.nbrm.gov.mkMinistry of Finance www.fin.gov.mkREAL GDP(MKD millions)CONSUMER PRICES (% CHANGE PA; AV)(%)2502001501005002005 2006 2007 2008 2009 20109876543210-12005 2006 2007 2008 2009 2010PAGE 114
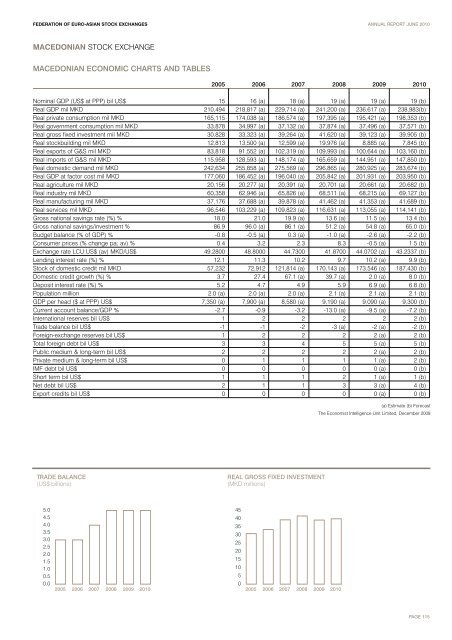
FEDERATION OF EURO-ASIAN STOCK EXCHANGES ANNUAL REPORT JUNE 2010MACEDONIAN STOCK EXCHANGEMACEDONIAN ECONOMIC CHARTS AND TABLES2005 2006 2007 2008 2009 2010Nominal GDP (US$ at PPP) bil US$ 15 16 (a) 18 (a) 19 (a) 19 (a) 19 (b)Real GDP mil MKD 210,494 218,817 (a) 229,714 (a) 241,200 (a) 236,617 (a) 238,983(b)Real private consumption mil MKD 165,115 174,038 (a) 186,574 (a) 197,395 (a) 195,421 (a) 198,353 (b)Real government consumption mil MKD 33,878 34,997 (a) 37,132 (a) 37,874 (a) 37,496 (a) 37,571 (b)Real gross fixed investment mil MKD 30,828 33,323 (a) 39,264 (a) 41,620 (a) 39,123 (a) 39,905 (b)Real stockbuilding mil MKD 12,813 13,500 (a) 12,599 (a) 19,976 (a) 8,885 (a) 7,845 (b)Real exports of G&S mil MKD 83,818 91,552 (a) 102,319 (a) 109,993 (a) 100,644 (a) 103,160 (b)Real imports of G&S mil MKD 115,958 128,593 (a) 148,174 (a) 165,659 (a) 144,951 (a) 147,850 (b)Real domestic demand mil MKD 242,634 255,858 (a) 275,569 (a) 296,865 (a) 280,925 (a) 283,674 (b)Real GDP at factor cost mil MKD 177,060 186,452 (a) 196,040 (a) 205,842 (a) 201,931 (a) 203,950 (b)Real agriculture mil MKD 20,156 20,277 (a) 20,391 (a) 20,701 (a) 20,661 (a) 20,682 (b)Real industry mil MKD 60,358 62,946 (a) 65,826 (a) 68,511 (a) 68,215 (a) 69,127 (b)Real manufacturing mil MKD 37,176 37,688 (a) 39,878 (a) 41,462 (a) 41,353 (a) 41,689 (b)Real services mil MKD 96,546 103,229 (a) 109,823 (a) 116,631 (a) 113,055 (a) 114,141 (b)Gross national savings rate (%) % 18.0 21.0 19.9 (a) 13.6 (a) 11.5 (a) 13.4 (b)Gross national savings/investment % 86.9 96.0 (a) 86.1 (a) 51.2 (a) 54.8 (a) 65.0 (b)Budget balance (% of GDP) % -0.8 -0.5 (a) 0.3 (a) -1.0 (a) -2.6 (a) -2.2 (b)Consumer prices (% change pa; av) % 0.4 3.2 2.3 8.3 -0.5 (a) 1.5 (b)Exchange rate LCU:US$ (av) MKD/US$ 49.2800 48.8000 44.7300 41.8700 44.0702 (a) 43.2337 (b)Lending interest rate (%) % 12.1 11.3 10.2 9.7 10.2 (a) 9.9 (b)Stock of domestic credit mil MKD 57,232 72,912 121,814 (a) 170,143 (a) 173,546 (a) 187,430 (b)Domestic credit growth (%) % 3.7 27.4 67.1 (a) 39.7 (a) 2.0 (a) 8.0 (b)Deposit interest rate (%) % 5.2 4.7 4.9 5.9 6.9 (a) 6.8 (b)Population million 2.0 (a) 2.0 (a) 2.0 (a) 2.1 (a) 2.1 (a) 2.1 (b)GDP per head ($ at PPP) US$ 7,350 (a) 7,900 (a) 8,580 (a) 9,190 (a) 9,090 (a) 9,300 (b)Current account balance/GDP % -2.7 -0.9 -3.2 -13.0 (a) -9.5 (a) -7.2 (b)International reserves bil US$ 1 2 2 2 2 2 (b)Trade balance bil US$ -1 -1 -2 -3 (a) -2 (a) -2 (b)Foreign-exchange reserves bil US$ 1 2 2 2 2 (a) 2 (b)Total foreign debt bil US$ 3 3 4 5 5 (a) 5 (b)Public medium & long-term bil US$ 2 2 2 2 2 (a) 2 (b)Private medium & long-term bil US$ 0 1 1 1 1 (a) 2 (b)IMF debt bil US$ 0 0 0 0 0 (a) 0 (b)Short term bil US$ 1 1 1 2 1 (a) 1 (b)Net debt bil US$ 2 1 1 3 3 (a) 4 (b)Export credits bil US$ 0 0 0 0 0 (a) 0 (b)(a) Estimate (b) ForecastThe Economist Intelligence Unit Limited, December 2009TRADE BALANCE(US$ billions)REAL GROSS FIXED INVESTMENT(MKD millions)5.04.54.03.53.02.52.01.51.00.50.02005 2006 2007 2008 2009 20104540353025201510502005 2006 2007 2008 2009 2010PAGE 115