FEDERATION OF EURO-ASIAN STOCK EXCHANGES ANNUAL REPORT JUNE 2010AMMAN STOCK EXCHANGEECONOMIC AND POLITICAL DEVELOPMENTSOutlook for 2010-11Power in Jordan will remain firmly in the hands of theking, Abdullah II, who is expected to retain the loyalsupport of the army and the security services.The cabinet will prioritise economic reform andstability over political liberalisation. An election isscheduled for late 2011, but parliament shouldremain conservative and tribally dominated, and thusgenerally pliant.The government is set to keep a tight rein onspending in 2010-11, in an effort to bring the fiscaldeficit down to a more manageable level. However,with revenue growth sluggish, the deficit will remainlarge.Although it will recover over the forecast period, realGDP growth is likely to remain below the highs of2004-08, as the economy struggles because of weakpublic spending growth and the end of theconstruction boom.Headline average inflation will rise sharply in 2010,but, once the declines in commodity prices of early2009 fall out of the year-on-year comparison, weexpect price growth to fall, to an average of 2.5% in2011.DOMESTIC POLITICS: King Abdullah is expected toremain in power throughout the forecast period andbeyond, supported by his loyal, well-trained andeffective armed forces. In July the king appointed hiseldest son, Prince Hussein, as crown prince,banishing any residual doubts there may have beenabout the succession. (The position had been vacantsince 2004, when King Abdullah removed the titlefrom his half-brother, Hamzah.) Nevertheless, threatsto stability will persist, with periodic outbursts ofIslamist violence possible, although these are mostlikely to be the result of actions of aggrievedindividuals (rather than organised groups), and thegeneral threat to security is relatively low. An electionis due in late 2011, but the EIU expects parliament toremain conservative and tribally dominated, and thusgenerally pliant (albeit resistant to economic reform).The only coherent parliamentary opposition, theIslamic Action Front, will remain beset by factional infighting,which, should it participate in the election,will undermine its chances of a strong showing. Onthe whole, however, domestic political machinationswill remain subordinate to the more immediateproblems associated with Israeli-Palestinian violenceand the fallout from the global economic recession.INTERNATIONAL RELATIONS: Jordan's pro-Westernorientation will remain the cornerstone of the king'sforeign policy, complemented by a policy ofmaintaining good relations with all Middle Easternstates in order to prevent regional tensions fromhaving a negative effect on the country. Jordan's tieswith the US have been buttressed by the increasedattention given to the Israeli-Palestinian conflict by theUS president, Barack Obama, but the failure of hisefforts to revive the peace process may lead Jordanto increasingly criticise US tactics–in particularregarding the US's perceived bias in favour of Israel.Meanwhile, ties with Iraq will continue to improve, ascommercial links between the two countries deepen,although Jordan will be wary of any resurgence inviolence in Iraq as the US troop drawdownprogresses. However, in reality, although the kingmay have a sympathetic ear in the White House,Jordan's direct influence on the myriad conflicts andrivalries that afflict the region will be limited, given theleadership's unwillingness to jeopardise its peacetreaty with Israel and its reliance on the US (andSaudi Arabia) for financial aid.POLICY TRENDS: Government policy will continue tofocus on shielding the population from the impact ofthe economic downturn, forcing the government todelay the introduction of a host of economic reforms.(For example, the National Investment Strategyappears to have been postponed.) The governmentis planning to overhaul the tax system, including byintroducing a 12% flat tax for nearly all corporationsand a simpler, two-tier income tax for individuals,although gaining parliamentary approval will bechallenging (and the fiscal cost of these measuresraises questions about affordability). Nevertheless, ifpassed, such changes, together with a scheme tostreamline the tariff system, could boost Jordan'sattractiveness to foreign investors. Because of itsheavy reliance on tourism and financial services, andbecause of the recent property boom, Jordan isespecially vulnerable to the global economicslowdown. Mindful of this, the government frontloadedcapital spending in the first half of 2009,although, given the fragile state of the publicfinances, it will be forced to rein in spending growthconsiderably from 2010.INTERNATIONAL ASSUMPTIONS: We estimate thatworld GDP (at purchasing power parity rates) willhave contracted by an estimated 1.3% in 2009, asthe deep recession in the EU and the US hasdragged down global growth, and expect it toexpand only weakly over the forecast period, by 3.2%in 2010 and 3.4% in 2011, led by non-OECD states.We forecast that the average price of dated BrentBlend will decline in 2011, as a number of OECDeconomies, including the US, experience a slowdownthat year, from US$74/barrel in 2010 to US$70/b.ECONOMIC GROWTH: Although it will recover overthe forecast period, real GDP growth in Jordan islikely to remain far below the highs it reached in2004-08, as the economy struggles in the face ofweak government spending growth and the ending ofthe construction boom. Although a number of leadingindicators, including the industrial price index, havepicked up lately, the ongoing slowdown in thedomestic financial sector will gradually spread acrossthe broader economy. In addition, having surged inrecent years (as the Gulf Arab states have channelledsome of their oil wealth into the country), inwardforeign direct investment will almost certainly declineas many Arab investors scale back their investmentplans. The difficult global economic situation is alsolikely to depress consumer confidence, although theeffect of this will dissipate in the latter stages of theforecast period. Exports will be restrained by sluggishgrowth in the US, but this should be partly offset byfast-rising demand for Jordanian goods fromneighbouring Iraq. Meanwhile, the gradual softeningof domestic demand will restrain import growth.Overall, we expect economic expansion to remain ataround 3% in 2010, before rising slightly in 2011, to3.7%, as a number of Jordan's export markets beginto strengthen and domestic construction activitypicks up again.INFLATION: We expect the year-on-year inflation rateto be volatile over the forecast period, although thiswill largely reflect the sharp variations in theconsumer price index in 2008-09 (owing to swings incommodity prices), rather than any shifting pricefundamentals within Jordan. Consumer prices havefallen back since the start of 2009, reflecting lowerinternational oil and food prices, as well as thestrengthening US dollar. However, with thesecurrency and commodity trends likely to reverseduring 2010, we expect inflation to rise from anestimated average rate of just 0.1% in 2009 to 5.5%in 2010. However, by end-2010, as the decreases incommodity prices fall out of the year-on-yearcomparison, we forecast that year-on-year pricegrowth will be just 1.1%. In 2011 we expect averageinflation to remain low, at 2.5%, as oil prices fallslightly and interest rates begin to rise.EXCHANGE RATES: The Central Bank of Jordan iscommitted to the maintenance of the Jordaniandinar's peg to the dollar, despite the associated lackof monetary flexibility and the recent weakening ofthe US currency. The peg has instilled monetaryconfidence and has not substantially harmedcompetitiveness (perhaps because the US isJordan's largest single export market). As a result, weexpect the CBJ to maintain the peg at JD0.709:US$1in 2010-11. We also believe that the stock ofinternational reserves (including gold), which hassurged in recent months, will be sufficient to offsetany pressure on the currency stemming from shorttermliquidity problems or negative politicaldevelopments.EXTERNAL SECTOR: We expect Jordan's currentaccountdeficit to narrow slowly over the forecastperiod, as a widening of the non-merchandisesurplus offsets increases in the trade deficit. Havingdeclined by an estimated 19% in 2009, toUS$12.1bn, the import bill is set to grow by around7% a year in 2010-11, as global commodity pricesand domestic demand begin to recover. Exports,meanwhile, will grow by an annual average of over8%, reaching US$7.9bn in 2011, as recoveringdemand in Asia, and increased re-export trade withIraq, makes up for sluggish demand in the US.Nevertheless, the trade deficit is forecast to widenfrom an estimated US$5.5bn (26.6% of GDP) in 2009to US$5.8bn 2010-11.**Information provided by Amman Stock ExchangeKey Information ContactsJordan Securities Commission www.jsc.gov.joSecurities Depository Center www.sdc.com.joJordan Investment Board www.jordaninvestment.comArab Monetary Fund www.amf.org.aeMinistry of Finance www.mof.gov.joCentral Bank of Jordan (CBJ) www.cbj.gov.joNational Information Center www.nic.gov.joDepartment of Statistics www.dos.gov.joPAGE 48
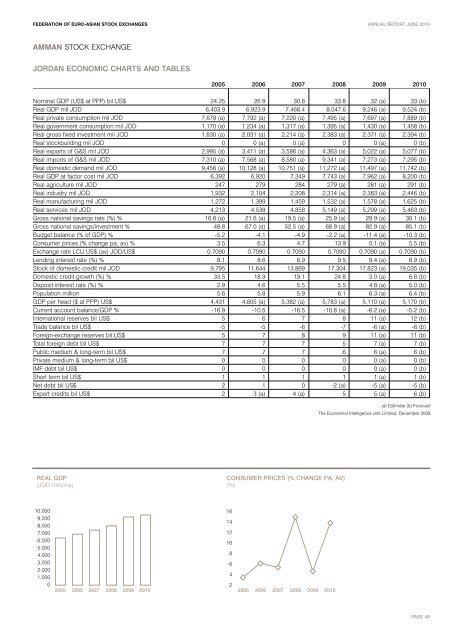
FEDERATION OF EURO-ASIAN STOCK EXCHANGES ANNUAL REPORT JUNE 2010AMMAN STOCK EXCHANGEJORDAN ECONOMIC CHARTS AND TABLES2005 2006 2007 2008 2009 2010Nominal GDP (US$ at PPP) bil US$ 24.25 26.9 30.8 33.8 32 (a) 33 (b)Real GDP mil JOD 6,403.9 6,923.9 7,468.4 8,047.6 9,246 (a) 9,524 (b)Real private consumption mil JOD 7,679 (a) 7,792 (a) 7,220 (a) 7,495 (a) 7,697 (a) 7,889 (b)Real government consumption mil JOD 1,170 (a) 1,234 (a) 1,317 (a) 1,395 (a) 1,430 (a) 1,458 (b)Real gross fixed investment mil JOD 1,830 (a) 2,031 (a) 2,214 (a) 2,383 (a) 2,371 (a) 2,394 (b)Real stockbuilding mil JOD 0 0 (a) 0 (a) 0 0 (a) 0 (b)Real exports of G&S mil JOD 2,995 (a) 3,411 (a) 3,586 (a) 4,363 (a) 5,022 (a) 5,077 (b)Real imports of G&S mil JOD 7,310 (a) 7,568 (a) 8,580 (a) 9,341 (a) 7,273 (a) 7,295 (b)Real domestic demand mil JOD 9,456 (a) 10,128 (a) 10,751 (a) 11,272 (a) 11,497 (a) 11,742 (b)Real GDP at factor cost mil JOD 6,392 6,920 7,349 7,743 (a) 7,962 (a) 8,200 (b)Real agriculture mil JOD 247 279 284 279 (a) 281 (a) 291 (b)Real industry mil JOD 1,932 2,104 2,208 2,314 (a) 2,383 (a) 2,446 (b)Real manufacturing mil JOD 1,272 1,399 1,459 1,532 (a) 1,578 (a) 1,625 (b)Real services mil JOD 4,213 4,538 4,858 5,149 (a) 5,299 (a) 5,463 (b)Gross national savings rate (%) % 16.6 (a) 21.6 (a) 19.5 (a) 25.9 (a) 29.9 (a) 30.1 (b)Gross national savings/investment % 48.8 67.0 (a) 52.5 (a) 68.9 (a) 82.9 (a) 85.1 (b)Budget balance (% of GDP) % -5.2 -4.1 -4.9 -2.2 (a) -11.4 (a) -10.3 (b)Consumer prices (% change pa; av) % 3.5 6.3 4.7 13.9 0.1 (a) 5.5 (b)Exchange rate LCU:US$ (av) JOD/US$ 0.7090 0.7090 0.7090 0.7090 0.7090 (a) 0.7090 (b)Lending interest rate (%) % 8.1 8.6 8.9 9.5 9.4 (a) 8.9 (b)Stock of domestic credit mil JOD 9,795 11,644 13,869 17,304 17,823 (a) 19,035 (b)Domestic credit growth (%) % 33.5 18.9 19.1 24.8 3.0 (a) 6.8 (b)Deposit interest rate (%) % 2.9 4.6 5.5 5.5 4.8 (a) 5.0 (b)Population million 5.6 5.8 5.9 6.1 6.3 (a) 6.4 (b)GDP per head ($ at PPP) US$ 4,431 4,805 (a) 5,382 (a) 5,783 (a) 5,110 (a) 5,170 (b)Current account balance/GDP % -16.9 -10.5 -16.5 -10.8 (a) -6.2 (a) -5.2 (b)International reserves bil US$ 5 6 7 8 11 (a) 12 (b)Trade balance bil US$ -5 -5 -6 -7 -6 (a) -6 (b)Foreign-exchange reserves bil US$ 5 7 8 9 11 (a) 11 (b)Total foreign debt bil US$ 7 7 7 5 7 (a) 7 (b)Public medium & long-term bil US$ 7 7 7 6 6 (a) 6 (b)Private medium & long-term bil US$ 0 0 0 0 0 (a) 0 (b)IMF debt bil US$ 0 0 0 0 0 (a) 0 (b)Short term bil US$ 1 1 1 1 1 (a) 1 (b)Net debt bil US$ 2 1 0 -2 (a) -5 (a) -5 (b)Export credits bil US$ 2 3 (a) 4 (a) 5 5 (a) 6 (b)(a) Estimate (b) ForecastThe Economist Intelligence Unit Limited, December 2009REAL GDP(JOD millions)CONSUMER PRICES (% CHANGE PA; AV)(%)10,0009,0008,0007,0006,0005,0004,0003,0002,0001,000022005 2006 2007 2008 2009 2010 2005 2006 2007 2008 2009 201016141210864PAGE 49