FEDERATION OF EURO-ASIAN STOCK EXCHANGES ANNUAL REPORT JUNE 2010TEHRAN STOCK EXCHANGEECONOMIC AND POLITICAL DEVELOPMENTSEconomic and Political EnvironmentThe president, Mahmoud Ahmadinejad, who wasinaugurated for a second term in August 2009,will continue to implement an unorthodox andpopulist conservative agenda over the forecastperiod that appears increasingly at odds withother powerful forces in Iran. In his first term, MrAhmadinejad ensured that any opposition to hishardline conservative policies from both withinand outside government was dealt with firmly.Such robustness, at the expense of political unity,is expected to continue in his next government.Despite the hardening of Iran's nuclear stance, itsleadership remains sensitive to popular opinion,which appears to want a peaceful resolution ofthe nuclear dispute. The Iranian administrationseems to be testing the diplomatic waters withthe US, with which Iran has had an exceptionallydifficult relationship since the 1979 Islamicrevolution. Following the election of BarackObama as US president, Iran appears morereceptive to the idea of direct diplomatic talkswith the US. Despite Mr Obama's apparentwillingness to engage with and reach out to theIranian leadership and people, the depth ofanimosity between the two countries, and theinternal pressures not to concede too much tothe other, is likely to mean that there will be onlyhalting progress towards rapprochement.Economic PerformanceThe new Ahmadinejad government will be understrong economic pressure to encourage foreigninvestment, after the sharp fall in international oilprices in early 2009 and because of the nearimpossibility of attracting project financing as aresult of sanctions and the global financialmeltdown. Lower oil prices mean that Iran can nolonger rely on its own resources for the majorinvestments needed to sustain oil production andmeet increased domestic demand for gas andelectricity. However, the combination of sanctions(imposed in response to Iran's ongoing nuclearprogramme) and the drying up of internationalcredit markets means that Iran has few viablealternatives. Owing to its nationalist stance, thegovernment will continue to seek to be selfreliant,favouring local firms where possible,especially in the energy and petrochemicalssectors. Given the concerns over futureinvestment, Iran's oil production capacity target of5.6m barrels/day (b/d) by 2010, up from anestimated 4m b/d at present, will not be metwithout outside help. Despite having pushed forand won a significant cut in OPEC output inresponse to a sharp decline in international oilprices, Iran's domestic economic situation willadd pressure on it to maintain its own productionlevels (which are nevertheless estimated to havedeclined marginally in 2009) to help to cushionitself against a significant fall in oil prices. If thenuclear dispute worsens markedly–leading to aneventual embargo on Iranian oil exports or anIranian cessation of output, or worse, militaryaction–the impact on economic policymakingwould be severe. Cutbacks in governmentspending would be required, and the ability ofIranian industries to source capital goods or rawmaterials from abroad would be disrupted.Iranian real GDP growth is forecast to strengthenslightly over the forecast period as a result ofhigher oil prices and rising oil output. Weestimate that real GDP growth will haveweakened in 2009/10 to just 0.5%, owing to thedrop in oil earnings over the year, which will haveaffected the rate of private consumption andinvestment growth. Although these trends will bereversed–especially in 2010—THE expected netoil export growth is to be held back by a lack ofrefining capacity in 2010-11, which is largely aresult of political interference and subduedforeign investor interest. This will continue toleave Iran increasingly reliant on fuel imports,which have been rising despite the imposition ofpetrol rationing in 2007. Despite this, Iranian realGDP is forecast to pick up steadily to 2.9% in2010/11, and further to 3.5% in 2011/12.With fiscal policy likely to remain expansionary,albeit not to the extent it was in previous years,concerns over inflation are set to persist in 2010-11. However, with international non-oil commodityprices remaining relatively low over the forecastperiod, annual inflation is expected to fall quitesharply to an average of 13.8% in 2010 and 12%in 2011. Latest official data show that consumerprice growth eased to 13.1% year on year inAugust 2009–its lowest level for almost threeyears.Bank Markazi (the central bank) has hithertoallowed the Iranian rial to weaken in nominalterms in order to support the competitiveness ofnon-oil exports. The rial will have depreciated onaverage by around 5% in nominal terms in 2009,with the currency averaging IR9,928:US$1 for theyear.The decline in oil export revenue will haveoutstripped the drop in import spending in2009/10, owing to the sharp fall in average oilprices. Overall, it is forecast that the trade surpluswill have shrunk considerably in 2009/10, to US$13bn, from over US$31bn in the previous year.However, because of a rise in global oil prices in2010, the trade surplus is expected to widen, toUS$24bn in 2010/11, before narrowing again in2011/12, to US$23bn, as oil prices drop slightly.The non-merchandise deficit is expected to fall alittle on average in 2010-11, as income andcurrent transfers surpluses offset an increase inthe services deficit. The rise in international oilprices will also have a positive impact on thecurrent-account surplus, which we forecast willwiden to over 3% of GDP in 2010/11, from anestimated surplus of just 0.6% of GDP in2009/10, before narrowing again to 2.7% of GDPin 2011/12.** The Economist Intelligence Unit Limited, November 2009Key Information ContactsTehran Stock Exchange Corporation; http://www.iranbourse.comSecurities and Exchange Organization; http://www.seo.irIranian Privatization Organization; http://www.en.ipo.irTSE’s Technology Management Company; http://english.tsetmc.comCentral Bank of the Islamic Republic of Iran; http://www.cbi.irIranian Chamber of Commerce, Industries and Mines (ICCIM); http://www.iccim.comOrganization for Investment, Economic & technical Assistance (OIETAI) a division of the Ministry of Finance; http://www.investiniran.irREAL GDP(IRR millions)CONSUMER PRICES (% CHANGE PA; AV)(%)6005004003002001000102005 2006 2007 2008 2009 2010 2005 2006 2007 2008 2009 20102624222018161412PAGE 148
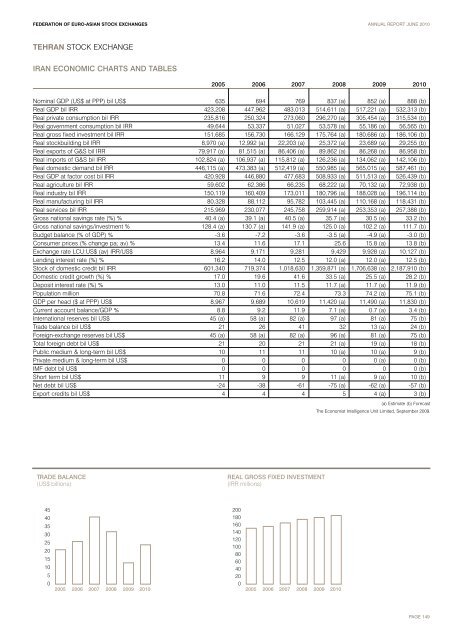
FEDERATION OF EURO-ASIAN STOCK EXCHANGES ANNUAL REPORT JUNE 2010TEHRAN STOCK EXCHANGEIRAN ECONOMIC CHARTS AND TABLES2005 2006 2007 2008 2009 2010Nominal GDP (US$ at PPP) bil US$ 635 694 769 837 (a) 852 (a) 888 (b)Real GDP bil IRR 423,208 447,962 483,013 514,611 (a) 517,221 (a) 532,313 (b)Real private consumption bil IRR 235,816 250,324 273,060 296,270 (a) 305,454 (a) 315,534 (b)Real government consumption bil IRR 49,644 53,337 51,027 53,578 (a) 55,186 (a) 56,565 (b)Real gross fixed investment bil IRR 151,685 156,730 166,129 175,764 (a) 180,686 (a) 186,106 (b)Real stockbuilding bil IRR 8,970 (a) 12,992 (a) 22,203 (a) 25,372 (a) 23,689 (a) 29,255 (b)Real exports of G&S bil IRR 79,917 (a) 81,515 (a) 86,406 (a) 89,862 (a) 86,268 (a) 86,958 (b)Real imports of G&S bil IRR 102,824 (a) 106,937 (a) 115,812 (a) 126,236 (a) 134,062 (a) 142,106 (b)Real domestic demand bil IRR 446,115 (a) 473,383 (a) 512,419 (a) 550,985 (a) 565,015 (a) 587,461 (b)Real GDP at factor cost bil IRR 420,928 446,880 477,683 508,933 (a) 511,513 (a) 526,439 (b)Real agriculture bil IRR 59,602 62,386 66,235 68,222 (a) 70,132 (a) 72,938 (b)Real industry bil IRR 150,119 160,409 173,011 180,796 (a) 188,028 (a) 196,114 (b)Real manufacturing bil IRR 80,328 88,112 95,782 103,445 (a) 110,168 (a) 118,431 (b)Real services bil IRR 215,969 230,077 245,758 259,914 (a) 253,353 (a) 257,388 (b)Gross national savings rate (%) % 40.4 (a) 39.1 (a) 40.5 (a) 35.7 (a) 30.5 (a) 33.2 (b)Gross national savings/investment % 128.4 (a) 130.7 (a) 141.9 (a) 125.0 (a) 102.2 (a) 111.7 (b)Budget balance (% of GDP) % -3.6 -7.2 -3.6 -3.5 (a) -4.9 (a) -3.0 (b)Consumer prices (% change pa; av) % 13.4 11.6 17.1 25.6 15.8 (a) 13.8 (b)Exchange rate LCU:US$ (av) IRR/US$ 8,964 9,171 9,281 9,429 9,928 (a) 10,127 (b)Lending interest rate (%) % 16.2 14.0 12.5 12.0 (a) 12.0 (a) 12.5 (b)Stock of domestic credit bil IRR 601,340 719,374 1,018,630 1,359,871 (a) 1,706,638 (a) 2,187,910 (b)Domestic credit growth (%) % 17.0 19.6 41.6 33.5 (a) 25.5 (a) 28.2 (b)Deposit interest rate (%) % 13.0 11.0 11.5 11.7 (a) 11.7 (a) 11.9 (b)Population million 70.8 71.6 72.4 73.3 74.2 (a) 75.1 (b)GDP per head ($ at PPP) US$ 8,967 9,689 10,619 11,420 (a) 11,490 (a) 11,830 (b)Current account balance/GDP % 8.8 9.2 11.9 7.1 (a) 0.7 (a) 3.4 (b)International reserves bil US$ 45 (a) 58 (a) 82 (a) 97 (a) 81 (a) 75 (b)Trade balance bil US$ 21 26 41 32 13 (a) 24 (b)Foreign-exchange reserves bil US$ 45 (a) 58 (a) 82 (a) 96 (a) 81 (a) 75 (b)Total foreign debt bil US$ 21 20 21 21 (a) 19 (a) 18 (b)Public medium & long-term bil US$ 10 11 11 10 (a) 10 (a) 9 (b)Private medium & long-term bil US$ 0 0 0 0 0 (a) 0 (b)IMF debt bil US$ 0 0 0 0 0 0 (b)Short term bil US$ 11 9 9 11 (a) 9 (a) 10 (b)Net debt bil US$ -24 -38 -61 -75 (a) -62 (a) -57 (b)Export credits bil US$ 4 4 4 5 4 (a) 3 (b)(a) Estimate (b) ForecastThe Economist Intelligence Unit Limited, September 2009.TRADE BALANCE(US$ billions)REAL GROSS FIXED INVESTMENT(IRR millions)4540353025201510502005 2006 2007 2008 2009 20102001801601401201008060402002005 2006 2007 2008 2009 2010PAGE 149