FEDERATION OF EURO-ASIAN STOCK EXCHANGES ANNUAL REPORT JUNE 2010BELARUSIAN CURRENCY AND STOCK EXCHANGEECONOMIC AND POLITICAL DEVELOPMENTSEconomic and Political EnvironmentThe president, Alyaksandar Lukashenka,retains tight control over the bureaucracy—including regional administrators, and military,security and law enforcement bodies—andwill use this to prevent the emergence ofalternative centres of power, and to discouragepotential rivals from seriously considering anattempt to dislodge him. Opposition partieswill continue to co-ordinate their strategies tosome degree, but will still face limits onpolitical participation and expression, and willremain divided along ideological lines.Nevertheless, the economic recessionexpected in 2009, exacerbated by adeterioration of Belarus's energy terms oftrade, brings risks.Engagement between the Lukashenka regimeand the EU and US is likely to continue toincrease, in a context of concerns about thethreat to Belarusian independence from aresurgent Russia and Mr Lukashenka's desireto attract more Western investment. However,Mr Lukashenka's reluctance to accept the bareminimum of political openness demanded bythe EU and the US will limit the improvement inties with the West, and the process could besubject to reversal if Mr Lukashenka feels thatit is not bringing the expected benefits.Belarus will remain closely tied to Russia.Russia's focus on its own commercial interestsin relation to Belarus—in particular, the longstandinggoal of its oil and gas companies toobtain important distribution and processingassets in Belarus—will continue to strainrelations at times. However, the two countrieswill remain close partners, co-operating ininternational and military affairs in the comingyears.Economic PerformanceThe government's statist economic model willcome under strain in 2009-10 as a result of theimpact of the global recession. Belarus agreeda US$2.5bn 15-month stand-by agreementwith the IMF in December 2008. However, theLukashenka administration derives much of itslegitimacy from tight state control over mostaspects of the economy and the prioritisationof social goals, such as full employmentand equitable income distribution. A wholesaledeparture from these policies is thereforeunlikely, and the government will avoidfar-ranging economic restructuring orderegulation, although limited improvementsin business regulation are possible.Russia, Ukraine and the EU, which areBelarus's leading export markets, willexperience recession in 2009. Real GDP grewby 10% in 2008. However, the global creditcrunch and the fall in export revenue willseriously constrain the authorities' ability tomaintain the loose fiscal and credit policiesthat have previously supported growth. Afurther rise, on average, in the price of Russiangas will place further strain on the economy.Inflation decelerated in the final months of2008, and after a brief spike in the first twomonths of 2009, under the impact of currencydepreciation and gas price rises, has sinceresumed its downward trend.. Average annualinflation will therefore fall from 14.8% in 2008to 12.1% in 2009 and 10% in 2010.The rubel was devalued by 20.5% against theUS dollar at the beginning of January and hassubsequently weakened further, despiteinterventions by the National Bank of theRepublic of Belarus (NBRB, the central bank)on foreign-exchange markets to support thecurrency.The trade deficit widened in 2008 and in thefirst quarter of 2009. Although high exportprices supported a strong export performancefor much of 2008, imports also rose rapidly,partly because of high energy prices, but alsobecause of rising domestic demand, and havebeen slower to correct following the collapseof exports from the final quarter of 2008. Thecurrent-account deficit in 2008 was 9.4% ofGDP and is forecast to narrow to around 6.5%of GDP in 2009. On the one hand, exports willfall owing to recessions in important markets.On the other hand, limited access to externalfinancing will force a marked correction todomestic demand, and imports will thereforefall even more sharply. The deficit will contractin 2010, to 5.5% of GDP, as exports pick upmore quickly than imports.** The Economist Intelligence Unit Limited, May 2009Key Information ContactsPresident of Belarus www.president.gov.by/en/Council of Ministers www.government.by/en/eng_news.htmlMinistry of Foreign Affairs www.mfa.gov.by/eng/index.php?id=2&d=contacts/linksBelarusian Telegraph Agency (National Source of Information) www.belta.by/en/REAL GDP(BYB millions)CONSUMER PRICES (% CHANGE PA; AV)(%)1815161414131212101186104928072005 2006 2007 2008 2009 2010 2005 2006 2007 2008 2009 2010PAGE 66
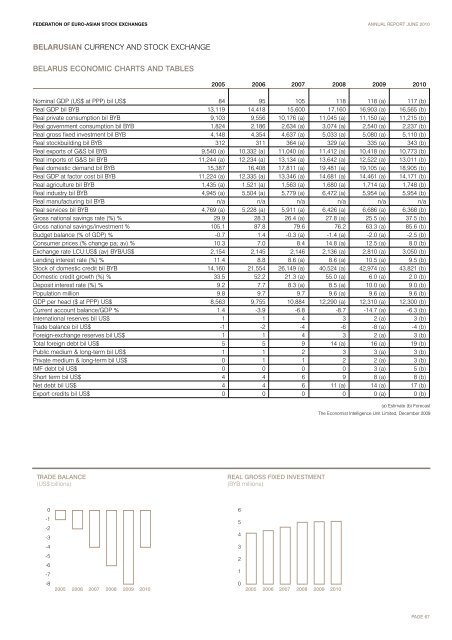
FEDERATION OF EURO-ASIAN STOCK EXCHANGES ANNUAL REPORT JUNE 2010BELARUSIAN CURRENCY AND STOCK EXCHANGEBELARUS ECONOMIC CHARTS AND TABLES2005 2006 2007 2008 2009 2010Nominal GDP (US$ at PPP) bil US$ 84 95 105 118 118 (a) 117 (b)Real GDP bil BYB 13,119 14,418 15,600 17,160 16,903 (a) 16,565 (b)Real private consumption bil BYB 9,103 9,556 10,176 (a) 11,045 (a) 11,150 (a) 11,215 (b)Real government consumption bil BYB 1,824 2,186 2,634 (a) 3,074 (a) 2,540 (a) 2,237 (b)Real gross fixed investment bil BYB 4,148 4,354 4,637 (a) 5,033 (a) 5,080 (a) 5,110 (b)Real stockbuilding bil BYB 312 311 364 (a) 329 (a) 335 (a) 343 (b)Real exports of G&S bil BYB 9,540 (a) 10,332 (a) 11,040 (a) 11,412 (a) 10,418 (a) 10,773 (b)Real imports of G&S bil BYB 11,244 (a) 12,234 (a) 13,134 (a) 13,642 (a) 12,522 (a) 13,011 (b)Real domestic demand bil BYB 15,387 16,408 17,811 (a) 19,481 (a) 19,105 (a) 18,905 (b)Real GDP at factor cost bil BYB 11,224 (a) 12,335 (a) 13,346 (a) 14,681 (a) 14,461 (a) 14,171 (b)Real agriculture bil BYB 1,435 (a) 1,521 (a) 1,563 (a) 1,680 (a) 1,714 (a) 1,748 (b)Real industry bil BYB 4,945 (a) 5,504 (a) 5,779 (a) 6,472 (a) 5,954 (a) 5,954 (b)Real manufacturing bil BYB n/a n/a n/a n/a n/a n/aReal services bil BYB 4,769 (a) 5,228 (a) 5,911 (a) 6,426 (a) 6,686 (a) 6,368 (b)Gross national savings rate (%) % 29.9 28.3 26.4 (a) 27.8 (a) 25.5 (a) 37.5 (b)Gross national savings/investment % 105.1 87.8 79.6 76.2 63.3 (a) 85.6 (b)Budget balance (% of GDP) % -0.7 1.4 -0.3 (a) -1.4 (a) -2.0 (a) -2.5 (b)Consumer prices (% change pa; av) % 10.3 7.0 8.4 14.8 (a) 12.5 (a) 8.0 (b)Exchange rate LCU:US$ (av) BYB/US$ 2,154 2,145 2,146 2,136 (a) 2,810 (a) 3,050 (b)Lending interest rate (%) % 11.4 8.8 8.6 (a) 8.6 (a) 10.5 (a) 9.5 (b)Stock of domestic credit bil BYB 14,160 21,554 26,149 (a) 40,524 (a) 42,974 (a) 43,821 (b)Domestic credit growth (%) % 33.5 52.2 21.3 (a) 55.0 (a) 6.0 (a) 2.0 (b)Deposit interest rate (%) % 9.2 7.7 8.3 (a) 8.5 (a) 10.0 (a) 9.0 (b)Population million 9.8 9.7 9.7 9.6 (a) 9.6 (a) 9.6 (b)GDP per head ($ at PPP) US$ 8,563 9,755 10,884 12,290 (a) 12,310 (a) 12,300 (b)Current account balance/GDP % 1.4 -3.9 -6.8 -8.7 -14.7 (a) -6.3 (b)International reserves bil US$ 1 1 4 3 2 (a) 3 (b)Trade balance bil US$ -1 -2 -4 -6 -8 (a) -4 (b)Foreign-exchange reserves bil US$ 1 1 4 3 2 (a) 3 (b)Total foreign debt bil US$ 5 5 9 14 (a) 16 (a) 19 (b)Public medium & long-term bil US$ 1 1 2 3 3 (a) 3 (b)Private medium & long-term bil US$ 0 1 1 2 2 (a) 3 (b)IMF debt bil US$ 0 0 0 0 3 (a) 5 (b)Short term bil US$ 4 4 6 9 8 (a) 8 (b)Net debt bil US$ 4 4 6 11 (a) 14 (a) 17 (b)Export credits bil US$ 0 0 0 0 0 (a) 0 (b)(a) Estimate (b) ForecastThe Economist Intelligence Unit Limited, December 2009TRADE BALANCE(US$ billions)REAL GROSS FIXED INVESTMENT(BYB millions)06-1-2-354-43-5-6-721-82005 2006 2007 2008 2009 201002005 2006 2007 2008 2009 2010PAGE 67