FEDERATION OF EURO-ASIAN STOCK EXCHANGES ANNUAL REPORT JUNE 2010MONGOLIAN STOCK EXCHANGEECONOMIC AND POLITICAL DEVELOPMENTSGDP real growth accelerated over the 2ndquarter of 2008, reaching 11.3% over thelast 12 months. The main engines of growthwere services and agriculture, contributing 4.2and 3.8 percentage points respectively to GDPgrowth. Although the direct contribution ofmining to economic growth is small or evennegative, this remains Mongolia’s main foreignexchange earner, with large export revenuesfrom high world metals prices and sustainedFDI flowing into the sector over the first half ofthe year.Copper prices fell recently on weakdemand, especially from sagging globalconstruction activity and higher inventories,with prices plunging sharply in early Octoberon concerns about global growth. FromAugust to early October, the total dropexceeded 40%.Wages and salaries are increasing in all partsof the economy and showed a rapid increaseof 69% in the first semester of 2008 (year-onyear),and of 119% over the last 2 years.Public sector wages were increased by 129%over the same period. The share of wages andsalaries in household incomes has increasedrapidly, from 40% in the 3rd quarter of 2007 to46% in the 2nd quarter of 2008.General Government budgetFor the preliminary result of 2008, totalrevenue and grants of General Governmentbudget totaled 2,156.4 billion togrogs, totalexpenditure and net lending 2,462.0 billiontogrogs and General Government budgetoverall balance was a deficit 305.7 billiontogrogs, which were representing 35.2%,40.2% and 5.0%of the GDP, respectively.Current revenue of General Governmentamounted to 2,136.1 billion togrogs andcurrent expenditure 1,749.5 billion togrogs.The budget current balance was a surplus386.6 billion togrogs.Compared to 2007, tax revenue increased by25.7% or 386.6 billion togrogs, taxes onforeign trade increased by 47.2% or 48.4billion togrogs, excise tax increased by 33.4%or 44.7 billion togrogs and value added taxincreased by 33.9% or 90.0 billion togrogs,accordingly.Money, loanAccording to the report of the Bank ofMongolia, at the end of December of 2008money supply (broad money or M2) increasedby 4.4% or 99.6 billion togrogs over theNovember of 2008, reaching 2341.4 billiontogrogs and decreased by 2.5% or 59.9 billiontogrogs compared to December of 2007.At the end of November of 2008, the reverseassets reached to US$ 606.3 million whichequals with the import needs of 8.7 weeks or2.2 months.The nominal rate of togrog against US dollar is1,267.51 togrog at the end of December 2008.Compared with December of 2007, rate oftogrog weaken by 8.3%.Consumer price indexIn December 2008, the national consumerprices increased by 0.04% compared withprevious month and by 22.1% from the end ofprevious year. CPI increase by 22.1% washigher 3.6 times than the objective in the MainGuidelines of Socio-Economic Development ofMongolia for 2008 which CPI shall be kept at6.0%. Annual average CPI for 2008 was28.0%, the highest growth over the lastdecade.External tradeFor the preliminary estimates of 2008, totalexternal trade turnover equaled US$ 6,155.1million. of which exports US$ 2,539.3 millionand imports US$ 3,615.8 million. Total externaltrade balance turned a deficit of US$ 1,076.5million. The deficit is increased by US$ 855.6million compared with the 2007. External tradedeficit has been influenced by the importgrowth of products and materials of fuelswhich is 36.3 point higher than export growth.As compared with the 2007, total externaltrade turnover increased by 49.4%, exports by30.3% and imports by 66.6% respectively.In the Main Guidelines of Socio-EconomicDevelopment 2008, there have special goalssuch as to improve external trade surplus, toraise net official reserves. But the total externaltrade balance deficit was US$ 1,076.5 millionand it is increased by US$ 855.6 million or 4.9times compared with the 2007.** National Statistical Office (www.nso.mn)World Bank Country Report(http://go.worldbank.org/D8H9DQNLZ0)Key Information ContactsParliament of Mongolia www.parl.gov.mnState Property Commission www.spc.gov.mnMinistry of Finance www.mof.pmis.gov.mnFinancial Regulatory Commission www.frc.mnThe Central Bank of Mongolia www.mongolbank.mnMongolian Chamber of Commerce & Industry www.mongolchamber.mnNational Statistical Office of Mongolia www.nso.mnMinistry of Foreign Affairs www.mfa.gov.mnREAL GDP*(MNT millions)CONSUMER PRICES (% CHANGE PA; AV)**(%)3.02.52.01.51.00.52520151050.002005 2006 2007 2008 2009 2005 2006 2007 2008 2009PAGE 122
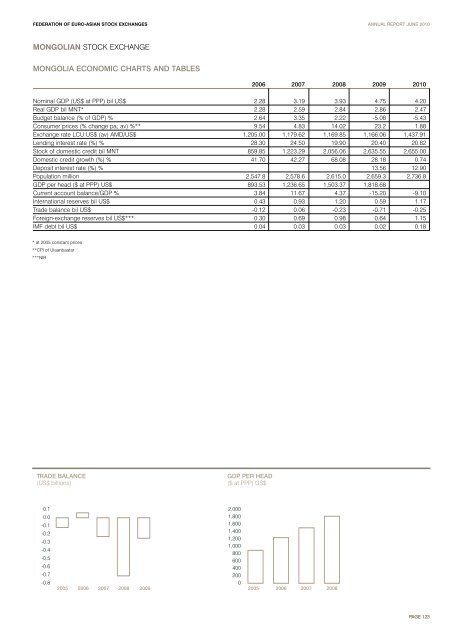
FEDERATION OF EURO-ASIAN STOCK EXCHANGES ANNUAL REPORT JUNE 2010MONGOLIAN STOCK EXCHANGEMONGOLIA ECONOMIC CHARTS AND TABLES2006 2007 2008 2009 2010Nominal GDP (US$ at PPP) bil US$ 2.28 3.19 3.93 4.75 4.20Real GDP bil MNT* 2.28 2.59 2.84 2.86 2.47Budget balance (% of GDP) % 2.64 3.35 2.22 -5.08 -5.43Consumer prices (% change pa; av) %** 9.54 4.83 14.02 23.2 1.88Exchange rate LCU:US$ (av) AMD/US$ 1,205.00 1,179.62 1,169.85 1,166.06 1,437.91Lending interest rate (%) % 28.30 24.50 19.90 20.40 20.82Stock of domestic credit bil MNT 859.85 1.223.29 2,056.06 2,635.55 2,655.00Domestic credit growth (%) % 41.70 42.27 68.08 28.18 0.74Deposit interest rate (%) % 13.56 12.90Population million 2,547.8 2,578.6 2,615.0 2,659.3 2,736.8GDP per head ($ at PPP) US$ 893.53 1,236.65 1,503.37 1,818.68Current account balance/GDP % 3.84 11.67 4.37 -15.20 -9.10International reserves bil US$ 0.43 0.93 1.20 0.59 1.17Trade balance bil US$ -0.12 0.06 -0.23 -0.71 -0.25Foreign-exchange reserves bil US$*** 0.30 0.69 0.98 0.64 1.15IMF debt bil US$ 0.04 0.03 0.03 0.02 0.18* at 2005 constant prices**CPI of Ulaanbaatar***NIRTRADE BALANCE(US$ billions)GDP PER HEAD($ at PPP) US$0.10.0-0.1-0.2-0.3-0.4-0.5-0.6-0.7-0.82005 2006 2007 2008 20092,0001,8001,6001,4001,2001,00080060040020002005 2006 2007 2008PAGE 123