FEDERATION OF EURO-ASIAN STOCK EXCHANGES ANNUAL REPORT JUNE 2010BUCHAREST STOCK EXCHANGEECONOMIC AND POLITICAL DEVELOPMENTSEconomic and Political EnvironmentRomania was plunged into a political crisis inOctober after the Social Democratic Party (SDP)withdrew from the government, leaving a minorityDemocratic Liberal Party (DLP) administration ledby the prime minister, Emil Boc, to face aparliamentary censure motion on October 13th.Mr Boc's government became the first postcommunistgovernment in Romania to fall as aresult of a successful no-confidence vote inparliament. A new government is unlikely to beformed until after the presidential election in earlyDecember.Romania was a net recipient of EU funding ofEUR1.4bn (US$2.1bn) in 2008, and EUassistance to Romania will play a central role inpreventing a sharper economic collapse andstimulating economic recovery. The EuropeanCommission's full report on Romania's progressin implementing judicial reform and combatingcorruption, released on July 22nd, recommendedthat safeguard clauses, which could haveincluded financial sanctions, should not beimplemented, in view of the progress made sincethe publication of the previous full report in July2008. The EU is also likely to have been alarmedby the speed with which the current political crisisdeveloped, and by the apparent inability ofleading political figures to compromise in order tofind a solution.Economic PerformanceIn 2007-08 the minority NLP governmentimplemented loose fiscal and wage policies at atime of excess aggregate demand, contributing toburgeoning current-account deficits, which werelargely financed by inflows of private capital.Consequently, Romania faced structuralmacroeconomic deficits that were aggravatedby the international financial crisis of September2008. The crisis choked off external financeand hit investor confidence, resulting in anaccelerated depreciation of the leu and significantfalls on the Bucharest Stock Exchange (BSE).In March 2009 the new government secured aprogramme of financial support worth EUR19.5bnfrom the IMF, the EU, the European InvestmentBank (EIB), and the European Bank forReconstruction and Development (EBRD), to bedisbursed over two or three years. It is intendedthat these credits will be repaid from 2011, largelythrough improved absorption of EU grant finance.Only a modest recovery is expected in 2010, withgrowth forecast at 1%, following an estimatedcontraction of 7.6% in 2009. Real GDP fell by7.6% year on year in the first half of 2009. In thesecond quarter it fell by 8.7% year on year and by1.1% quarter on quarter–the fourth consecutivequarterly decline. We expect further quarter-onquarterfalls in the third and fourth quarters, asdomestic consumption remains depressed. Aftera slow recovery in 2010, growth is forecast torebound in 2011, to 4%. There is still a downsiderisk that the recession will be deeper and moreprotracted than in our baseline forecast,especially if additional austerity measures arerequired in 2010-11 to bring budget deficits intoline with EU targets.After slowing to an estimated average of 5.4% in2009, average consumer price inflation is forecastto decelerate further, to 3.5% in 2010 and to 3.4%in 2011. The depreciation of the leu provided animpetus to inflation in early 2009, but low world oilprices (relative to 2007-08), as well as fallinginternational and domestic demand, exerteddownward pressure on prices as the yearprogressed. Consumer prices rose by 3.2% inJanuary-September 2009, taking the year-on-yearrate to 4.9% in September. We estimate that thecontraction in domestic demand, and the fall incost-push inflation from energy and food prices,will bring inflation below the top end of the NBR'starget range by the end of 2009. Provided thatfiscal and incomes policies are tightened, andthat wage growth is curtailed, inflation should fallto 3.8% by the end of 2010, and to around 3.3%by the end of 2011. The main risks to the inflationforecast are tied to the exchange rate, which maycome under further downward pressure, and tothe possibility that the rate of value-added tax(VAT) may be raised in 2010.The leu fell to a historic low of Lei3.4:US$1 and ofLei4.3:EUR1 in February 2009, despiteinterventions by the NBR, but rallied after theannouncement of multilateral assistance inMarch. The leu appreciated against both the USdollar and the euro before the political crisis inlate 2009, but fell back towards Lei4.3:EUR1thereafter. The NBR has announced that itsinterventions in the foreign-exchange market willbe "cautious", which could result in increasedvolatility. Its attempts to mitigate this will behelped by its strengthened foreign-exchangereserves, which reached EUR28.3bn at the end ofSeptember. A correction to the exchange rate ofthe long-overvalued leu was desirable, givenworries about declining competitiveness.However, based on estimates of equilibriumexchange rates, it is possible that the leu is stillsignificantly overvalued. The potential problemsfor Romania's competitiveness are compoundedby the fact that other currencies in the regiondepreciated substantially in 2009.The current-account deficit shrank by 79% yearon year in January-August 2009, to EUR2.4bn,mainly because of a 69% contraction of the tradedeficit, to EUR3.9bn, and a 61% reduction in theincome deficit, as repatriated profits from directinvestment declined. However, the currenttransfers surplus declined by 31% and servicesrecorded a small deficit, compared with aEUR448m (US$630m) surplus in the year-earlierperiod. A sharp downward adjustment of thecurrent-account deficit, from 12.4% of GDP in2008 to around 5% of GDP, is estimated in 2009.Slower lending and wage growth will keep acheck on both imports and the trade deficit in2010-11.** The Economist Intelligence Unit Limited, November 2009Key Information ContactsNational Securities Commission www.cnvmr.roMinistry of Public Finance www.mfinante.roNational Bank of Romania www.bnro.roUNOPC www.unopc.roNational Institute of Statistics www.insse.roRomanian capital market www.kmarket.roREAL GDP(ROL millions)CONSUMER PRICES (% CHANGE PA; AV)(%)2502001501005004.04.55.05.56.06.57.07.58.08.59.02005 2006 2007 2008 2009 2010 2005 2006 2007 2008 2009 2010PAGE 74
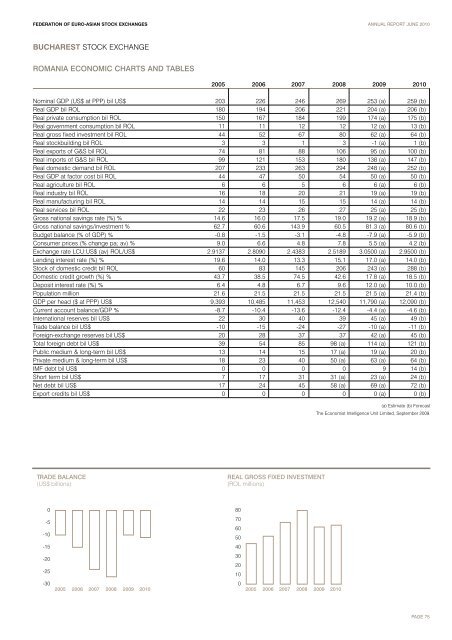
FEDERATION OF EURO-ASIAN STOCK EXCHANGES ANNUAL REPORT JUNE 2010BUCHAREST STOCK EXCHANGEROMANIA ECONOMIC CHARTS AND TABLES2005 2006 2007 2008 2009 2010Nominal GDP (US$ at PPP) bil US$ 203 226 246 269 253 (a) 259 (b)Real GDP bil ROL 180 194 206 221 204 (a) 206 (b)Real private consumption bil ROL 150 167 184 199 174 (a) 175 (b)Real government consumption bil ROL 11 11 12 12 12 (a) 13 (b)Real gross fixed investment bil ROL 44 52 67 80 62 (a) 64 (b)Real stockbuilding bil ROL 3 3 1 3 -1 (a) 1 (b)Real exports of G&S bil ROL 74 81 88 106 95 (a) 100 (b)Real imports of G&S bil ROL 99 121 153 180 138 (a) 147 (b)Real domestic demand bil ROL 207 233 263 294 248 (a) 252 (b)Real GDP at factor cost bil ROL 44 47 50 54 50 (a) 50 (b)Real agriculture bil ROL 6 6 5 6 6 (a) 6 (b)Real industry bil ROL 16 18 20 21 19 (a) 19 (b)Real manufacturing bil ROL 14 14 15 15 14 (a) 14 (b)Real services bil ROL 22 23 26 27 25 (a) 25 (b)Gross national savings rate (%) % 14.6 16.0 17.5 19.0 19.2 (a) 18.9 (b)Gross national savings/investment % 62.7 60.6 143.9 60.5 81.3 (a) 80.6 (b)Budget balance (% of GDP) % -0.8 -1.5 -3.1 -4.8 -7.9 (a) -5.9 (b)Consumer prices (% change pa; av) % 9.0 6.6 4.8 7.8 5.5 (a) 4.2 (b)Exchange rate LCU:US$ (av) ROL/US$ 2.9137 2.8090 2.4383 2.5189 3.0500 (a) 2.9500 (b)Lending interest rate (%) % 19.6 14.0 13.3 15.1 17.0 (a) 14.0 (b)Stock of domestic credit bil ROL 60 83 145 206 243 (a) 288 (b)Domestic credit growth (%) % 43.7 38.5 74.5 42.6 17.8 (a) 18.5 (b)Deposit interest rate (%) % 6.4 4.8 6.7 9.6 12.0 (a) 10.0 (b)Population million 21.6 21.5 21.5 21.5 21.5 (a) 21.4 (b)GDP per head ($ at PPP) US$ 9,393 10,485 11,453 12,540 11,790 (a) 12,090 (b)Current account balance/GDP % -8.7 -10.4 -13.6 -12.4 -4.4 (a) -4.6 (b)International reserves bil US$ 22 30 40 39 45 (a) 49 (b)Trade balance bil US$ -10 -15 -24 -27 -10 (a) -11 (b)Foreign-exchange reserves bil US$ 20 28 37 37 42 (a) 45 (b)Total foreign debt bil US$ 39 54 85 98 (a) 114 (a) 121 (b)Public medium & long-term bil US$ 13 14 15 17 (a) 19 (a) 20 (b)Private medium & long-term bil US$ 18 23 40 50 (a) 63 (a) 64 (b)IMF debt bil US$ 0 0 0 0 9 14 (b)Short term bil US$ 7 17 31 31 (a) 23 (a) 24 (b)Net debt bil US$ 17 24 45 58 (a) 69 (a) 72 (b)Export credits bil US$ 0 0 0 0 0 (a) 0 (b)(a) Estimate (b) ForecastThe Economist Intelligence Unit Limited, September 2009.TRADE BALANCE(US$ billions)REAL GROSS FIXED INVESTMENT(ROL millions)0-5-10-15-20-25-302005 2006 2007 2008 2009 2010807060504030201002005 2006 2007 2008 2009 2010PAGE 75