FEDERATION OF EURO-ASIAN STOCK EXCHANGES ANNUAL REPORT JUNE 2010ZAGREB STOCK EXCHANGEECONOMIC AND POLITICAL DEVELOPMENTSPolitic and Economic EnvironmentThe centre-right government led by the HDZfaces serious challenges in 2010-11. Theunblocking of the stalled EU accessionnegotiations is a boost for the government, but itmust now make rapid progress with the requiredreforms for accession, get results in the fightagainst corruption and organised crime, andimplement policies to help the economy to getthrough the current crisis. In addition, the HDZfaces the challenge of maintaining its direction,following the surprise resignation as primeminister of Ivo Sanader, the party's leader since2000, in July. Jadranka Kosor has assumed theparty leadership and received support from theHDZ's coalition partners. However, the transitionhas given rise to a degree of discord within theHDZ, and Mrs Kosor's attempts over the comingmonths to cement her position and support basepresent some risk to the stability of thegovernment. It is necessary for Mrs Kosor to dothis, as the HDZ lags the Social Democratic Party(SDP) in the latest opinion polls, and unless theHDZ can unite and lead an effective governmentin 2010-11, the SDP will become the favorite togain the most support in the parliamentaryelection due in 2011.Although opinion polls suggest that the Croatianpublic remain less than enthusiastic about theEU, Croatian politicians will pursue EUmembership as their main foreign policy goal.Croatian accession negotiations were held upthrough most of 2009, owing to the borderdispute with Slovenia. However, following abreakthrough in talks, Slovenia removed its defacto block on Croatian accession negotiations inSeptember. Croatia now has a realistic chance ofcompleting negotiations in the first half of 2010.Croatia's EU aspirations also received a massiveboost from the Irish "yes" vote to the Lisbon treaty.However, much ground still needs to be coveredin accession negotiations, and 2011 is the earliestlikely date for EU entry.Given the broad-based support for EU integrationamong political parties, the government willcontinue to adhere to an agenda of EU-mandatedreforms. Control of the main economic ministrieshas helped the HDZ to avert attempts by thealliance of the Croatian Peasants' Party (HSS)and the Croatian Social Liberal Party (HSLS) toimpede reform. The government will aim tocomplete the technical phase of the negotiationsby the middle of 2010. Owing to the economicdownturn, the previous and new HDZgovernments have been forced to revise the2009 budget. The government would still like tointroduce further expenditure cuts in the form ofreduced salaries to employees of state-ownedcompanies, but is likely to face significantopposition to this. The vexed privatization ofthe shipyards could yet stretch the governmentfinances further in 2009-10, as well as hold upEU accession and put the government underpressure of social unrest.In January 2010. opposition Social Democrat IvoJosipovic, the 52-year-old law professor andclassical music composer, has won Croatia'spresidential election by a wide margin andsucceeds Stipe Mesic after 10 years as president.Although the presidential function is mainlyceremonial with limited powers on foreign policy,defense and the intelligence services, MrJosipovic has pledged to lead a fight againstcorruption and to help the government completeEU membership talks this year.Economic PerformanceEuro area GDP is estimated to have contractedby 4.1% in 2009, and the recovery in 2010 is stillexpected to be modest, with world growth pickingup to 3.2% at purchasing power parity (PPP)exchange rates (previously forecast at 2.9%) andthe euro zone economy growing by just 0.8%(previously 0.5%). The weakness of demand inthe EU will continue to curtail Croatian exports ofgoods and services. We estimate the averageprice for dated Brent Blend crude oil to reachUS$62/barrel in 2009, rising to US$74/b in 2010,before slipping to US$70/b in 2011, when weexpect US growth to dip slightly. We forecast thatthe US dollar will depreciate mildly in 2010 as riskaversion diminishes.Real GDP contracted by 6.3% year on year inthe second quarter of 2009, after a first-quarterdrop of 6.7%. Although this may signal that therecession has stabilised for now, it does notsuggest that a speedy recovery is likely. In Augustand September, data for retail sales and industrialoutput did not indicate a clear recovery, andcredit growth remained minimal. Reflecting acombination of depressed consumption, reducedinvestment activity and gloomy trading conditionsaffecting Croatian exports and tourism, we estimatereal GDP to have contracted by 5.4% in 2009.Owing to the drop in international oil pricesand the moderation of food prices, together withthe sharp contraction in domestic demand, weestimate that average annual inflation is decliningto an average of 2.5% in 2009 from 6.1% in 2008.We forecast that inflation will remain low in 2010-11, at an average of 2.5%, as domestic demandremains subdued, wage growth remains limitedand oil prices grow only slowly. The CroatianNational Bank (CNB, the central bank) iscommitted to using a stable exchange rate as anominal anchor for monetary policy. Although thekuna is likely to depreciate slightly against theeuro and the US dollar in the final quarter afterthe end of the tourism season, the currency willnot weaken so much as to make importedinflation a significant problem.If necessary, the CNB will continue to intervenein the currency market to minimize the volatilityof the kuna. The slow recovery in domesticdemand in Croatia will allow the current accountto continue to correct, owing to limited importgrowth and stronger tourism revenue. Thecurrent-account deficit is expected to moderateto an average of 5.1% in 2010-11.** The Economist Intelligence Unit Limited, November 2009Key Information ContactsCroatian Agency for Supervision of Financial Services www.hanfa.hrMinistry of Finance www.mfin.hrCroatian Government www.vlada.hrREAL GDP(HRK millions)CONSUMER PRICES (% CHANGE PA; AV)(%)2502001501005002.02005 2006 2007 2008 2009 2010 2005 2006 2007 2008 2009 20106.56.05.55.04.54.03.53.02.5PAGE 164
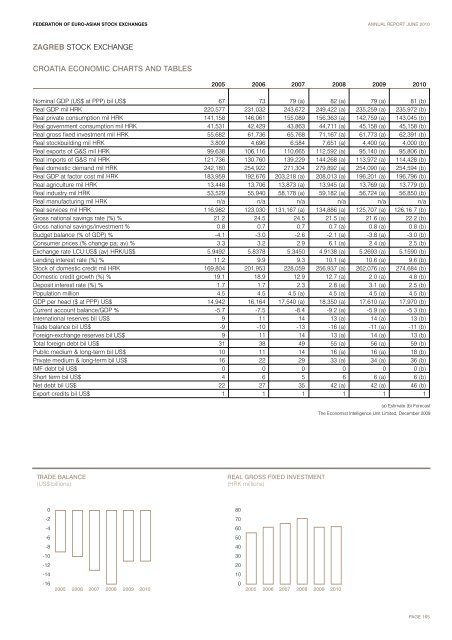
FEDERATION OF EURO-ASIAN STOCK EXCHANGES ANNUAL REPORT JUNE 2010ZAGREB STOCK EXCHANGECROATIA ECONOMIC CHARTS AND TABLES2005 2006 2007 2008 2009 2010Nominal GDP (US$ at PPP) bil US$ 67 73 79 (a) 82 (a) 79 (a) 81 (b)Real GDP mil HRK 220,577 231,032 243,672 249,422 (a) 235,259 (a) 235,972 (b)Real private consumption mil HRK 141,158 146,061 155,089 156,363 (a) 142,759 (a) 143,045 (b)Real government consumption mil HRK 41,531 42,429 43,863 44,711 (a) 45,158 (a) 45,158 (b)Real gross fixed investment mil HRK 55,682 61,736 65,768 71,167 (a) 61,773 (a) 62,391 (b)Real stockbuilding mil HRK 3,809 4,696 6,584 7,651 (a) 4,400 (a) 4,000 (b)Real exports of G&S mil HRK 99,638 106,116 110,665 112,592 (a) 95,140 (a) 95,806 (b)Real imports of G&S mil HRK 121,736 130,760 139,229 144,268 (a) 113,972 (a) 114,428 (b)Real domestic demand mil HRK 242,180 254,922 271,304 279,892 (a) 254,090 (a) 254,594 (b)Real GDP at factor cost mil HRK 183,959 192,676 203,218 (a) 208,013 (a) 196,201 (a) 196,796 (b)Real agriculture mil HRK 13,448 13,706 13,873 (a) 13,945 (a) 13,769 (a) 13,779 (b)Real industry mil HRK 53,529 55,940 58,178 (a) 59,182 (a) 56,724 (a) 56,850 (b)Real manufacturing mil HRK n/a n/a n/a n/a n/a n/aReal services mil HRK 116,982 123,030 131,167 (a) 134,886 (a) 125,707 (a) 126,16 7 (b)Gross national savings rate (%) % 21.2 24.5 24.5 21.5 (a) 21.6 (a) 22.2 (b)Gross national savings/investment % 0.8 0.7 0.7 0.7 (a) 0.8 (a) 0.8 (b)Budget balance (% of GDP) % -4.1 -3.0 -2.6 -2.1 (a) -3.8 (a) -3.0 (b)Consumer prices (% change pa; av) % 3.3 3.2 2.9 6.1 (a) 2.4 (a) 2.5 (b)Exchange rate LCU:US$ (av) HRK/US$ 5.9492 5.8378 5.3450 4.9138 (a) 5.2693 (a) 5.1590 (b)Lending interest rate (%) % 11.2 9.9 9.3 10.1 (a) 10.6 (a) 9.6 (b)Stock of domestic credit mil HRK 169,804 201,953 228,059 256,937 (a) 262,076 (a) 274,684 (b)Domestic credit growth (%) % 19.1 18.9 12.9 12.7 (a) 2.0 (a) 4.8 (b)Deposit interest rate (%) % 1.7 1.7 2.3 2.8 (a) 3.1 (a) 2.5 (b)Population million 4.5 4.5 4.5 (a) 4.5 (a) 4.5 (a) 4.5 (b)GDP per head ($ at PPP) US$ 14,942 16,164 17,540 (a) 18,350 (a) 17,610 (a) 17,970 (b)Current account balance/GDP % -5.7 -7.5 -8.4 -9.2 (a) -5.9 (a) -5.3 (b)International reserves bil US$ 9 11 14 13 (a) 14 (a) 13 (b)Trade balance bil US$ -9 -10 -13 -16 (a) -11 (a) -11 (b)Foreign-exchange reserves bil US$ 9 11 14 13 (a) 14 (a) 13 (b)Total foreign debt bil US$ 31 38 49 55 (a) 56 (a) 59 (b)Public medium & long-term bil US$ 10 11 14 16 (a) 16 (a) 18 (b)Private medium & long-term bil US$ 16 22 29 33 (a) 34 (a) 36 (b)IMF debt bil US$ 0 0 0 0 0 0 (b)Short term bil US$ 4 6 5 6 6 (a) 6 (b)Net debt bil US$ 22 27 35 42 (a) 42 (a) 46 (b)Export credits bil US$ 1 1 1 1 1 1(a) Estimate (b) ForecastThe Economist Intelligence Unit Limited, December 2009TRADE BALANCE(US$ billions)REAL GROSS FIXED INVESTMENT(HRK millions)0-2-4-6-8-10-12-14-162005 2006 2007 2008 2009 2010807060504030201002005 2006 2007 2008 2009 2010PAGE 165