

Download - FEAS
Download - FEAS
Download - FEAS
- No tags were found...

Create successful ePaper yourself
Turn your PDF publications into a flip-book with our unique Google optimized e-Paper software.
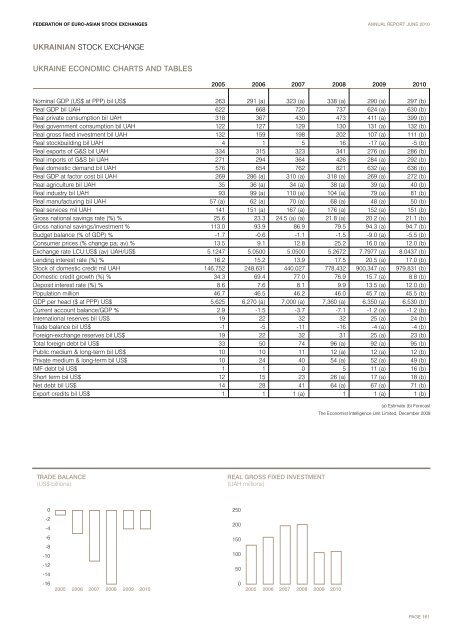
FEDERATION OF EURO-ASIAN STOCK EXCHANGES ANNUAL REPORT JUNE 2010UKRAINIAN STOCK EXCHANGEUKRAINE ECONOMIC CHARTS AND TABLES2005 2006 2007 2008 2009 2010Nominal GDP (US$ at PPP) bil US$ 263 291 (a) 323 (a) 338 (a) 290 (a) 297 (b)Real GDP bil UAH 622 668 720 737 624 (a) 630 (b)Real private consumption bil UAH 318 367 430 473 411 (a) 399 (b)Real government consumption bil UAH 122 127 129 130 131 (a) 132 (b)Real gross fixed investment bil UAH 132 159 198 202 107 (a) 111 (b)Real stockbuilding bil UAH 4 1 5 16 -17 (a) -5 (b)Real exports of G&S bil UAH 334 315 323 341 276 (a) 286 (b)Real imports of G&S bil UAH 271 294 364 426 284 (a) 292 (b)Real domestic demand bil UAH 576 654 762 821 632 (a) 636 (b)Real GDP at factor cost bil UAH 269 286 (a) 310 (a) 318 (a) 269 (a) 272 (b)Real agriculture bil UAH 35 36 (a) 34 (a) 38 (a) 39 (a) 40 (b)Real industry bil UAH 93 99 (a) 110 (a) 104 (a) 79 (a) 81 (b)Real manufacturing bil UAH 57 (a) 62 (a) 70 (a) 68 (a) 48 (a) 50 (b)Real services mil UAH 141 151 (a) 167 (a) 176 (a) 152 (a) 151 (b)Gross national savings rate (%) % 25.6 23.3 24.5 (a) (a) 21.8 (a) 20.2 (a) 21.1 (b)Gross national savings/investment % 113.0 93.9 86.9 79.5 94.3 (a) 94.7 (b)Budget balance (% of GDP) % -1.7 -0.6 -1.1 -1.5 -9.0 (a) -5.5 (b)Consumer prices (% change pa; av) % 13.5 9.1 12.8 25.2 16.0 (a) 12.0 (b)Exchange rate LCU:US$ (av) UAH/US$ 5.1247 5.0500 5.0500 5.2672 7.7977 (a) 8.0437 (b)Lending interest rate (%) % 16.2 15.2 13.9 17.5 20.5 (a) 17.0 (b)Stock of domestic credit mil UAH 146,752 248,631 440,027 778,432 900,347 (a) 979,831 (b)Domestic credit growth (%) % 34.3 69.4 77.0 76.9 15.7 (a) 8.8 (b)Deposit interest rate (%) % 8.6 7.6 8.1 9.9 13.5 (a) 12.0 (b)Population million 46.7 46.5 46.2 46.0 45.7 (a) 45.5 (b)GDP per head ($ at PPP) US$ 5,625 6,270 (a) 7,000 (a) 7,360 (a) 6,350 (a) 6,530 (b)Current account balance/GDP % 2.9 -1.5 -3.7 -7.1 -1.2 (a) -1.2 (b)International reserves bil US$ 19 22 32 32 25 (a) 24 (b)Trade balance bil US$ -1 -5 -11 -16 -4 (a) -4 (b)Foreign-exchange reserves bil US$ 19 22 32 31 25 (a) 23 (b)Total foreign debt bil US$ 33 50 74 96 (a) 92 (a) 95 (b)Public medium & long-term bil US$ 10 10 11 12 (a) 12 (a) 12 (b)Private medium & long-term bil US$ 10 24 40 54 (a) 52 (a) 49 (b)IMF debt bil US$ 1 1 0 5 11 (a) 16 (b)Short term bil US$ 12 15 23 26 (a) 17 (a) 18 (b)Net debt bil US$ 14 28 41 64 (a) 67 (a) 71 (b)Export credits bil US$ 1 1 1 (a) 1 1 (a) 1 (b)(a) Estimate (b) ForecastThe Economist Intelligence Unit Limited, December 2009TRADE BALANCE(US$ billions)REAL GROSS FIXED INVESTMENT(UAH millions)0250-2-4200-6-8-10150100-12-1450-162005 2006 2007 2008 2009 201002005 2006 2007 2008 2009 2010PAGE 161


