ICT and e-Business Impact in the Retail Industry - empirica
ICT and e-Business Impact in the Retail Industry - empirica
ICT and e-Business Impact in the Retail Industry - empirica
- No tags were found...

Create successful ePaper yourself
Turn your PDF publications into a flip-book with our unique Google optimized e-Paper software.
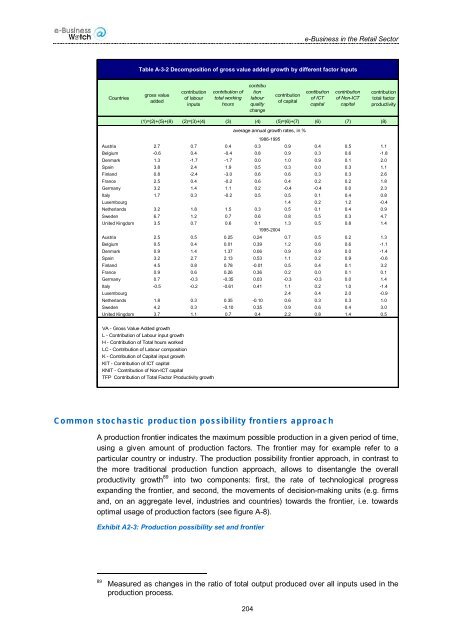
e-<strong>Bus<strong>in</strong>ess</strong> <strong>in</strong> <strong>the</strong> <strong>Retail</strong> SectorTable A-3-2 Decomposition of gross value added growth by different factor <strong>in</strong>putsCountriesgross valueaddedcontributionof labour<strong>in</strong>putscontribution oftotal work<strong>in</strong>ghourscontributionlabourqualitychangecontributionof capitalcontibutionof <strong>ICT</strong>capitalcontributionof Non-<strong>ICT</strong>capitalcontributiontotal factorproductivity(1)=(2)+(5)+(8) (2)=(3)+(4) (3) (4) (5)=(6)+(7) (6) (7) (8)average annual growth rates, <strong>in</strong> %1986-1995Austria 2.7 0.7 0.4 0.3 0.9 0.4 0.5 1.1Belgium -0.6 0.4 -0.4 0.8 0.9 0.3 0.6 -1.8Denmark 1.3 -1.7 -1.7 0.0 1.0 0.9 0.1 2.0Spa<strong>in</strong> 3.8 2.4 1.9 0.5 0.3 0.0 0.3 1.1F<strong>in</strong>l<strong>and</strong> 0.8 -2.4 -3.0 0.6 0.6 0.3 0.3 2.6France 2.5 0.4 -0.2 0.6 0.4 0.2 0.2 1.8Germany 3.2 1.4 1.1 0.2 -0.4 -0.4 0.0 2.3Italy 1.7 0.3 -0.2 0.5 0.5 0.1 0.4 0.8Luxembourg 1.4 0.2 1.2 -0.4Ne<strong>the</strong>rl<strong>and</strong>s 3.2 1.8 1.5 0.3 0.5 0.1 0.4 0.9Sweden 6.7 1.2 0.7 0.6 0.8 0.5 0.3 4.7United K<strong>in</strong>gdom 3.5 0.7 0.6 0.1 1.3 0.5 0.8 1.41995-2004Austria 2.5 0.5 0.25 0.24 0.7 0.5 0.2 1.3Belgium 0.5 0.4 0.01 0.39 1.2 0.6 0.6 -1.1Denmark 0.9 1.4 1.37 0.06 0.9 0.9 0.0 -1.4Spa<strong>in</strong> 3.2 2.7 2.13 0.53 1.1 0.2 0.9 -0.6F<strong>in</strong>l<strong>and</strong> 4.5 0.8 0.78 -0.01 0.5 0.4 0.1 3.2France 0.9 0.6 0.26 0.36 0.2 0.0 0.1 0.1Germany 0.7 -0.3 -0.35 0.03 -0.3 -0.3 0.0 1.4Italy -0.5 -0.2 -0.61 0.41 1.1 0.2 1.0 -1.4Luxembourg 2.4 0.4 2.0 -0.9Ne<strong>the</strong>rl<strong>and</strong>s 1.8 0.3 0.35 -0.10 0.6 0.3 0.3 1.0Sweden 4.2 0.3 -0.10 0.35 0.9 0.6 0.4 3.0United K<strong>in</strong>gdom 3.7 1.1 0.7 0.4 2.2 0.8 1.4 0.5VA - Gross Value Added growthL - Contribution of Labour <strong>in</strong>put growthH - Contribution of Total hours workedLC - Contribution of Labour compositionK - Contribution of Capital <strong>in</strong>put growthKIT - Contribution of <strong>ICT</strong> capitalKNIT - Contribution of Non-<strong>ICT</strong> capitalTFP Contribution of Total Factor Productivity growthCommon stochastic production possibility frontiers approachA production frontier <strong>in</strong>dicates <strong>the</strong> maximum possible production <strong>in</strong> a given period of time,us<strong>in</strong>g a given amount of production factors. The frontier may for example refer to aparticular country or <strong>in</strong>dustry. The production possibility frontier approach, <strong>in</strong> contrast to<strong>the</strong> more traditional production function approach, allows to disentangle <strong>the</strong> overallproductivity growth 89 <strong>in</strong>to two components: first, <strong>the</strong> rate of technological progressexp<strong>and</strong><strong>in</strong>g <strong>the</strong> frontier, <strong>and</strong> second, <strong>the</strong> movements of decision-mak<strong>in</strong>g units (e.g. firms<strong>and</strong>, on an aggregate level, <strong>in</strong>dustries <strong>and</strong> countries) towards <strong>the</strong> frontier, i.e. towardsoptimal usage of production factors (see figure A-8).Exhibit A2-3: Production possibility set <strong>and</strong> frontier89Measured as changes <strong>in</strong> <strong>the</strong> ratio of total output produced over all <strong>in</strong>puts used <strong>in</strong> <strong>the</strong>production process.204