Download GL800 Software Manual pdf (9.7MB) - Graphtec America
Download GL800 Software Manual pdf (9.7MB) - Graphtec America
Download GL800 Software Manual pdf (9.7MB) - Graphtec America
- No tags were found...

You also want an ePaper? Increase the reach of your titles
YUMPU automatically turns print PDFs into web optimized ePapers that Google loves.
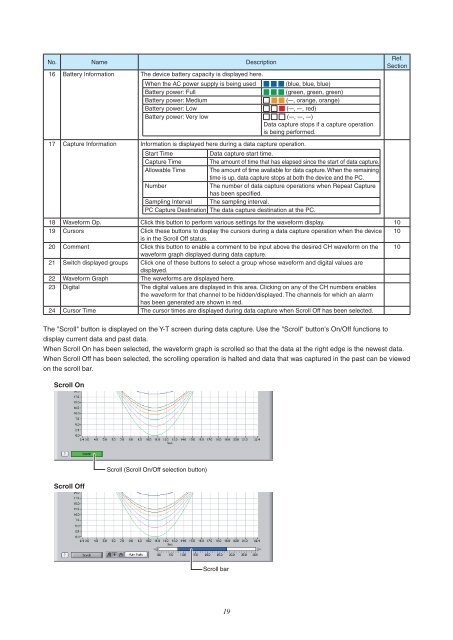
No. Name Description16 Battery Information The device battery capacity is displayed here.When the AC power supply is being used (blue, blue, blue)Battery power: Full (green, green, green)Battery power: Medium (–, orange, orange)Battery power: Low (–, –, red)Battery power: Very low (–, –, –)Data capture stops if a capture operationis being performed.17 Capture Information Information is displayed here during a data capture operation.Start TimeData capture start time.Capture Time The amount of time that has elapsed since the start of data capture.Allowable Time The amount of time available for data capture. When the remainingtime is up, data capture stops at both the device and the PC.NumberThe number of data capture operations when Repeat Capturehas been specified.Sampling Interval The sampling interval.PC Capture Destination The data capture destination at the PC.Ref.Section18 Waveform Op. Click this button to perform various settings for the waveform display. 1019 Cursors Click these buttons to display the cursors during a data capture operation when the device 10is in the Scroll Off status.20 Comment Click this button to enable a comment to be input above the desired CH waveform on the 10waveform graph displayed during data capture.21 Switch displayed groups Click one of these buttons to select a group whose waveform and digital values aredisplayed.22 Waveform Graph The waveforms are displayed here.23 Digital The digital values are displayed in this area. Clicking on any of the CH numbers enablesthe waveform for that channel to be hidden/displayed. The channels for which an alarmhas been generated are shown in red.24 Cursor Time The cursor times are displayed during data capture when Scroll Off has been selected.The "Scroll" button is displayed on the Y-T screen during data capture. Use the "Scroll" button's On/Off functions todisplay current data and past data.When Scroll On has been selected, the waveform graph is scrolled so that the data at the right edge is the newest data.When Scroll Off has been selected, the scrolling operation is halted and data that was captured in the past can be viewedon the scroll bar.Scroll OnScroll Off19