pre-feasibility assessment report - Innovationeasterncape.co.za
pre-feasibility assessment report - Innovationeasterncape.co.za
pre-feasibility assessment report - Innovationeasterncape.co.za

Create successful ePaper yourself
Turn your PDF publications into a flip-book with our unique Google optimized e-Paper software.
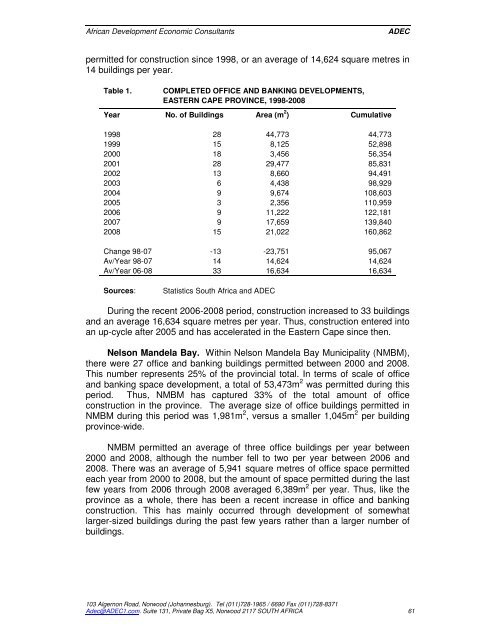
African Development E<strong>co</strong>nomic ConsultantsADECpermitted for <strong>co</strong>nstruction since 1998, or an average of 14,624 square metres in14 buildings per year.Table 1.COMPLETED OFFICE AND BANKING DEVELOPMENTS,EASTERN CAPE PROVINCE, 1998-2008Year No. of Buildings Area (m 2 ) Cumulative1998 28 44,773 44,7731999 15 8,125 52,8982000 18 3,456 56,3542001 28 29,477 85,8312002 13 8,660 94,4912003 6 4,438 98,9292004 9 9,674 108,6032005 3 2,356 110,9592006 9 11,222 122,1812007 9 17,659 139,8402008 15 21,022 160,862Change 98-07 -13 -23,751 95,067Av/Year 98-07 14 14,624 14,624Av/Year 06-08 33 16,634 16,634Sources:Statistics South Africa and ADECDuring the recent 2006-2008 period, <strong>co</strong>nstruction increased to 33 buildingsand an average 16,634 square metres per year. Thus, <strong>co</strong>nstruction entered intoan up-cycle after 2005 and has accelerated in the Eastern Cape since then.Nelson Mandela Bay. Within Nelson Mandela Bay Municipality (NMBM),there were 27 office and banking buildings permitted between 2000 and 2008.This number re<strong>pre</strong>sents 25% of the provincial total. In terms of scale of officeand banking space development, a total of 53,473m 2 was permitted during thisperiod. Thus, NMBM has captured 33% of the total amount of office<strong>co</strong>nstruction in the province. The average size of office buildings permitted inNMBM during this period was 1,981m 2 , versus a smaller 1,045m 2 per buildingprovince-wide.NMBM permitted an average of three office buildings per year between2000 and 2008, although the number fell to two per year between 2006 and2008. There was an average of 5,941 square metres of office space permittedeach year from 2000 to 2008, but the amount of space permitted during the lastfew years from 2006 through 2008 averaged 6,389m 2 per year. Thus, like theprovince as a whole, there has been a recent increase in office and banking<strong>co</strong>nstruction. This has mainly occurred through development of somewhatlarger-sized buildings during the past few years rather than a larger number ofbuildings.103 Algernon Road, Norwood (Johannesburg). Tel (011)728-1965 / 6690 Fax (011)728-8371Adec@ADEC1.<strong>co</strong>m. Suite 131, Private Bag X5, Norwood 2117 SOUTH AFRICA 61