pre-feasibility assessment report - Innovationeasterncape.co.za
pre-feasibility assessment report - Innovationeasterncape.co.za
pre-feasibility assessment report - Innovationeasterncape.co.za

Create successful ePaper yourself
Turn your PDF publications into a flip-book with our unique Google optimized e-Paper software.
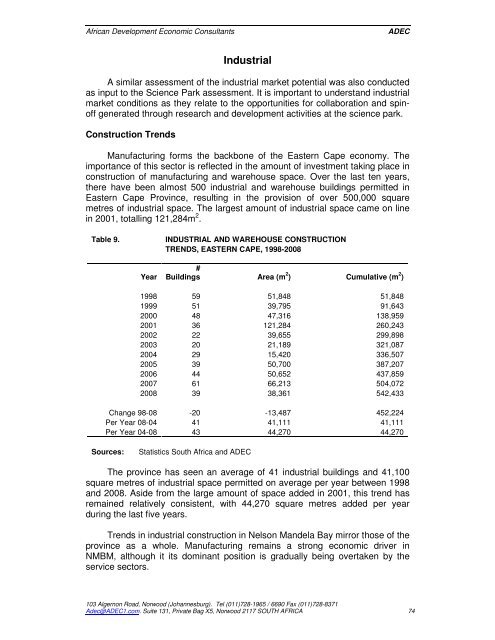
African Development E<strong>co</strong>nomic ConsultantsADECIndustrialA similar <strong>assessment</strong> of the industrial market potential was also <strong>co</strong>nductedas input to the Science Park <strong>assessment</strong>. It is important to understand industrialmarket <strong>co</strong>nditions as they relate to the opportunities for <strong>co</strong>llaboration and spinoffgenerated through research and development activities at the science park.Construction TrendsManufacturing forms the backbone of the Eastern Cape e<strong>co</strong>nomy. Theimportance of this sector is reflected in the amount of investment taking place in<strong>co</strong>nstruction of manufacturing and warehouse space. Over the last ten years,there have been almost 500 industrial and warehouse buildings permitted inEastern Cape Province, resulting in the provision of over 500,000 squaremetres of industrial space. The largest amount of industrial space came on linein 2001, totalling 121,284m 2 .Table 9.INDUSTRIAL AND WAREHOUSE CONSTRUCTIONTRENDS, EASTERN CAPE, 1998-2008Year#Buildings Area (m 2 ) Cumulative (m 2 )1998 59 51,848 51,8481999 51 39,795 91,6432000 48 47,316 138,9592001 36 121,284 260,2432002 22 39,655 299,8982003 20 21,189 321,0872004 29 15,420 336,5072005 39 50,700 387,2072006 44 50,652 437,8592007 61 66,213 504,0722008 39 38,361 542,433Change 98-08 -20 -13,487 452,224Per Year 08-04 41 41,111 41,111Per Year 04-08 43 44,270 44,270Sources:Statistics South Africa and ADECThe province has seen an average of 41 industrial buildings and 41,100square metres of industrial space permitted on average per year between 1998and 2008. Aside from the large amount of space added in 2001, this trend hasremained relatively <strong>co</strong>nsistent, with 44,270 square metres added per yearduring the last five years.Trends in industrial <strong>co</strong>nstruction in Nelson Mandela Bay mirror those of theprovince as a whole. Manufacturing remains a strong e<strong>co</strong>nomic driver inNMBM, although it its dominant position is gradually being overtaken by theservice sectors.103 Algernon Road, Norwood (Johannesburg). Tel (011)728-1965 / 6690 Fax (011)728-8371Adec@ADEC1.<strong>co</strong>m. Suite 131, Private Bag X5, Norwood 2117 SOUTH AFRICA 74