Local Planning Policy Framework - Moreland City Council
Local Planning Policy Framework - Moreland City Council
Local Planning Policy Framework - Moreland City Council

Create successful ePaper yourself
Turn your PDF publications into a flip-book with our unique Google optimized e-Paper software.
Central Coburg 2020 Background Report [ PHASE 1: Research and Analysis ]<br />
new census is revealing evidence of the trend towards gentrification. This is signalled<br />
by the growing numbers of professionals within the population and increases in the<br />
gap between high and low incomes.<br />
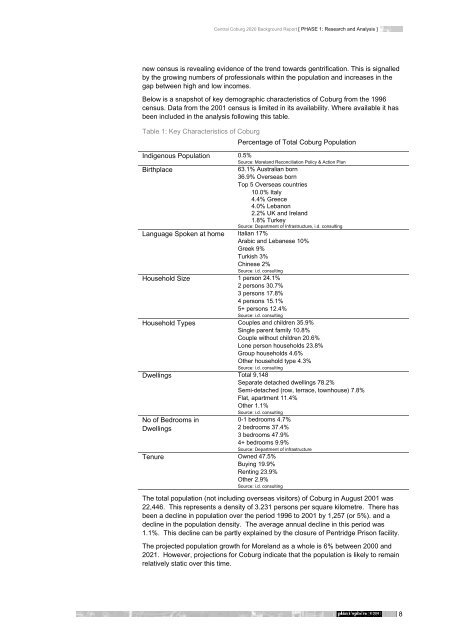
Below is a snapshot of key demographic characteristics of Coburg from the 1996<br />
census. Data from the 2001 census is limited in its availability. Where available it has<br />
been included in the analysis following this table.<br />
Table 1: Key Characteristics of Coburg<br />
Indigenous Population<br />
Birthplace<br />
Language Spoken at home<br />
Household Size<br />
Household Types<br />
Dwellings<br />
No of Bedrooms in<br />
Dwellings<br />
Tenure<br />
Percentage of Total Coburg Population<br />
0.5%<br />
Source: <strong>Moreland</strong> Reconciliation <strong>Policy</strong> & Action Plan<br />
63.1% Australian born<br />
36.9% Overseas born<br />
Top 5 Overseas countries<br />
10.0% Italy<br />
4.4% Greece<br />
4.0% Lebanon<br />
2.2% UK and Ireland<br />
1.8% Turkey<br />
Source: Department of Infrastructure, i.d. consulting<br />
Italian 17%<br />
Arabic and Lebanese 10%<br />
Greek 9%<br />
Turkish 3%<br />
Chinese 2%<br />
Source: i.d. consulting<br />
1 person 24.1%<br />
2 persons 30.7%<br />
3 persons 17.8%<br />
4 persons 15.1%<br />
5+ persons 12.4%<br />
Source: i.d. consulting<br />
Couples and children 35.9%<br />
Single parent family 10.8%<br />
Couple without children 20.6%<br />
Lone person households 23.8%<br />
Group households 4.6%<br />
Other household type 4.3%<br />
Source: i.d. consulting<br />
Total 9,148<br />
Separate detached dwellings 78.2%<br />
Semi-detached (row, terrace, townhouse) 7.8%<br />
Flat, apartment 11.4%<br />
Other 1.1%<br />
Source: i.d. consulting<br />
0-1 bedrooms 4.7%<br />
2 bedrooms 37.4%<br />
3 bedrooms 47.9%<br />
4+ bedrooms 9.9%<br />
Source: Department of infrastructure<br />
Owned 47.5%<br />
Buying 19.9%<br />
Renting 23.9%<br />
Other 2.9%<br />
Source: i.d. consulting<br />
The total population (not including overseas visitors) of Coburg in August 2001 was<br />
22,446. This represents a density of 3.231 persons per square kilometre. There has<br />
been a decline in population over the period 1996 to 2001 by 1,257 (or 5%). and a<br />
decline in the population density. The average annual decline in this period was<br />
1.1%. This decline can be partly explained by the closure of Pentridge Prison facility.<br />
The projected population growth for <strong>Moreland</strong> as a whole is 6% between 2000 and<br />
2021. However, projections for Coburg indicate that the population is likely to remain<br />
relatively static over this time.<br />
8