Local Planning Policy Framework - Moreland City Council
Local Planning Policy Framework - Moreland City Council
Local Planning Policy Framework - Moreland City Council
You also want an ePaper? Increase the reach of your titles
YUMPU automatically turns print PDFs into web optimized ePapers that Google loves.
Central Coburg 2020 Background Report [ PHASE 1: Research and Analysis ]<br />
proportional increase) in the ‘English only’ category. Proportional declines are<br />
apparent in the top four non-English speaking groups over this period.<br />
<strong>Moreland</strong> as a whole has a high level of residents practicing a faith, however the<br />
1996-2001 period has seen a changing faith profile for the Coburg area. Proportional<br />
declines slightly exceeding the overall rate of population decline were recorded for all<br />
of the major faith groups, with the exception of Islam. Anglican (-17%), Uniting<br />
Church (-34%) and Presbyterian & Reformed (-50%) registered particularly high<br />
proportional declines. These declines are reflected in an overall decline of 11% for<br />
‘Christian’ groups. Growth in the ‘Non-Christian’ religious category has been only<br />
minor, at 1%. The largest growth was registered in the ‘Inadequately Described’<br />
category.<br />
Employment<br />
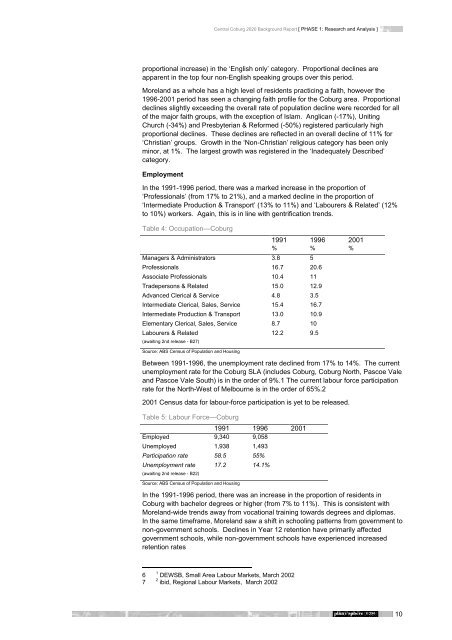
In the 1991-1996 period, there was a marked increase in the proportion of<br />
‘Professionals’ (from 17% to 21%), and a marked decline in the proportion of<br />
‘Intermediate Production & Transport’ (13% to 11%) and ‘Labourers & Related’ (12%<br />
to 10%) workers. Again, this is in line with gentrification trends.<br />
Table 4: Occupation—Coburg<br />
Managers & Administrators 3.8 5<br />
1991 1996 2001<br />
% % %<br />
Professionals 16.7 20.6<br />
Associate Professionals 10.4 11<br />
Tradepersons & Related 15.0 12.9<br />
Advanced Clerical & Service 4.8 3.5<br />
Intermediate Clerical, Sales, Service 15.4 16.7<br />
Intermediate Production & Transport 13.0 10.9<br />
Elementary Clerical, Sales, Service 8.7 10<br />
Labourers & Related 12.2 9.5<br />
(awaiting 2nd release - B27)<br />
Source: ABS Census of Population and Housing<br />
Between 1991-1996, the unemployment rate declined from 17% to 14%. The current<br />
unemployment rate for the Coburg SLA (includes Coburg, Coburg North, Pascoe Vale<br />
and Pascoe Vale South) is in the order of 9%.1 The current labour force participation<br />
rate for the North-West of Melbourne is in the order of 65%.2<br />
2001 Census data for labour-force participation is yet to be released.<br />
Table 5: Labour Force—Coburg<br />
1991 1996 2001<br />
Employed 9,340 9,058<br />
Unemployed 1,938 1,493<br />
Participation rate 58.5 55%<br />
Unemployment rate 17.2 14.1%<br />
(awaiting 2nd release - B22)<br />
Source: ABS Census of Population and Housing<br />
In the 1991-1996 period, there was an increase in the proportion of residents in<br />
Coburg with bachelor degrees or higher (from 7% to 11%). This is consistent with<br />
<strong>Moreland</strong>-wide trends away from vocational training towards degrees and diplomas.<br />
In the same timeframe, <strong>Moreland</strong> saw a shift in schooling patterns from government to<br />
non-government schools. Declines in Year 12 retention have primarily affected<br />
government schools, while non-government schools have experienced increased<br />
retention rates<br />
6<br />
7<br />
1<br />
DEWSB, Small Area Labour Markets, March 2002<br />
2<br />
ibid, Regional Labour Markets, March 2002<br />
10


