Local Planning Policy Framework - Moreland City Council
Local Planning Policy Framework - Moreland City Council
Local Planning Policy Framework - Moreland City Council

You also want an ePaper? Increase the reach of your titles
YUMPU automatically turns print PDFs into web optimized ePapers that Google loves.
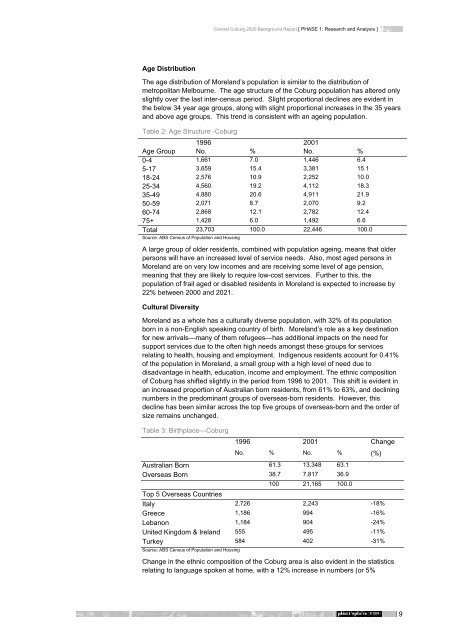
Age Distribution<br />
Central Coburg 2020 Background Report [ PHASE 1: Research and Analysis ]<br />
The age distribution of <strong>Moreland</strong>’s population is similar to the distribution of<br />
metropolitan Melbourne. The age structure of the Coburg population has altered only<br />
slightly over the last inter-census period. Slight proportional declines are evident in<br />
the below 34 year age groups, along with slight proportional increases in the 35 years<br />
and above age groups. This trend is consistent with an ageing population.<br />
Table 2: Age Structure -Coburg<br />
1996 2001<br />
Age Group No. % No. %<br />
0-4 1,661 7.0 1,446 6.4<br />
5-17 3,659 15.4 3,381 15.1<br />
18-24 2,576 10.9 2,252 10.0<br />
25-34 4,560 19.2 4,112 18.3<br />
35-49 4,880 20.6 4,911 21.9<br />
50-59 2,071 8.7 2,070 9.2<br />
60-74 2,868 12.1 2,782 12.4<br />
75+ 1,428 6.0 1,492 6.6<br />
Total 23,703 100.0 22,446 100.0<br />
Source: ABS Census of Population and Housing<br />
A large group of older residents, combined with population ageing, means that older<br />
persons will have an increased level of service needs. Also, most aged persons in<br />
<strong>Moreland</strong> are on very low incomes and are receiving some level of age pension,<br />
meaning that they are likely to require low-cost services. Further to this, the<br />
population of frail aged or disabled residents in <strong>Moreland</strong> is expected to increase by<br />
22% between 2000 and 2021.<br />
Cultural Diversity<br />
<strong>Moreland</strong> as a whole has a culturally diverse population, with 32% of its population<br />
born in a non-English speaking country of birth. <strong>Moreland</strong>’s role as a key destination<br />
for new arrivals—many of them refugees—has additional impacts on the need for<br />
support services due to the often high needs amongst these groups for services<br />
relating to health, housing and employment. Indigenous residents account for 0.41%<br />
of the population in <strong>Moreland</strong>, a small group with a high level of need due to<br />
disadvantage in health, education, income and employment. The ethnic composition<br />
of Coburg has shifted slightly in the period from 1996 to 2001. This shift is evident in<br />
an increased proportion of Australian born residents, from 61% to 63%, and declining<br />
numbers in the predominant groups of overseas-born residents. However, this<br />
decline has been similar across the top five groups of overseas-born and the order of<br />
size remains unchanged.<br />
Table 3: Birthplace—Coburg<br />
1996 2001 Change<br />
No. % No. % (%)<br />
Australian Born 61.3 13,348 63.1<br />
Overseas Born 38.7 7,817 36.9<br />
100 21,165 100.0<br />
Top 5 Overseas Countries<br />
Italy 2,726 2,243 -18%<br />
Greece 1,186 994 -16%<br />
Lebanon 1,184 904 -24%<br />
United Kingdom & Ireland 555 495 -11%<br />
Turkey 584 402 -31%<br />
Source: ABS Census of Population and Housing<br />
Change in the ethnic composition of the Coburg area is also evident in the statistics<br />
relating to language spoken at home, with a 12% increase in numbers (or 5%<br />
9