Student Flow at Primary Level - DISE
Student Flow at Primary Level - DISE
Student Flow at Primary Level - DISE
- No tags were found...
You also want an ePaper? Increase the reach of your titles
YUMPU automatically turns print PDFs into web optimized ePapers that Google loves.
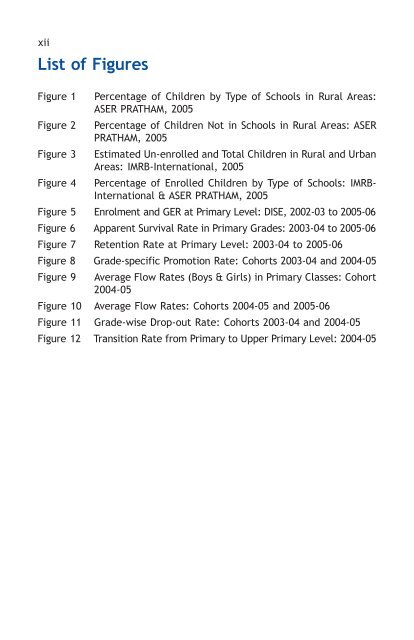
xiiList of FiguresFigure 1 Percentage of Children by Type of Schools in Rural Areas:ASER PRATHAM, 2005Figure 2 Percentage of Children Not in Schools in Rural Areas: ASERPRATHAM, 2005Figure 3 Estim<strong>at</strong>ed Un-enrolled and Total Children in Rural and UrbanAreas: IMRB-Intern<strong>at</strong>ional, 2005Figure 4 Percentage of Enrolled Children by Type of Schools: IMRB-Intern<strong>at</strong>ional & ASER PRATHAM, 2005Figure 5 Enrolment and GER <strong>at</strong> <strong>Primary</strong> <strong>Level</strong>: <strong>DISE</strong>, 2002-03 to 2005-06Figure 6 Apparent Survival R<strong>at</strong>e in <strong>Primary</strong> Grades: 2003-04 to 2005-06Figure 7 Retention R<strong>at</strong>e <strong>at</strong> <strong>Primary</strong> <strong>Level</strong>: 2003-04 to 2005-06Figure 8 Grade-specific Promotion R<strong>at</strong>e: Cohorts 2003-04 and 2004-05Figure 9 Average <strong>Flow</strong> R<strong>at</strong>es (Boys & Girls) in <strong>Primary</strong> Classes: Cohort2004-05Figure 10 Average <strong>Flow</strong> R<strong>at</strong>es: Cohorts 2004-05 and 2005-06Figure 11 Grade-wise Drop-out R<strong>at</strong>e: Cohorts 2003-04 and 2004-05Figure 12 Transition R<strong>at</strong>e from <strong>Primary</strong> to Upper <strong>Primary</strong> <strong>Level</strong>: 2004-05


