Discussion Paper - Part A - Victorian Environmental Assessment ...
Discussion Paper - Part A - Victorian Environmental Assessment ...
Discussion Paper - Part A - Victorian Environmental Assessment ...
- No tags were found...

Create successful ePaper yourself
Turn your PDF publications into a flip-book with our unique Google optimized e-Paper software.
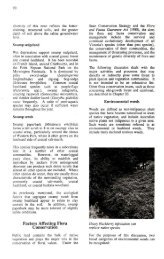
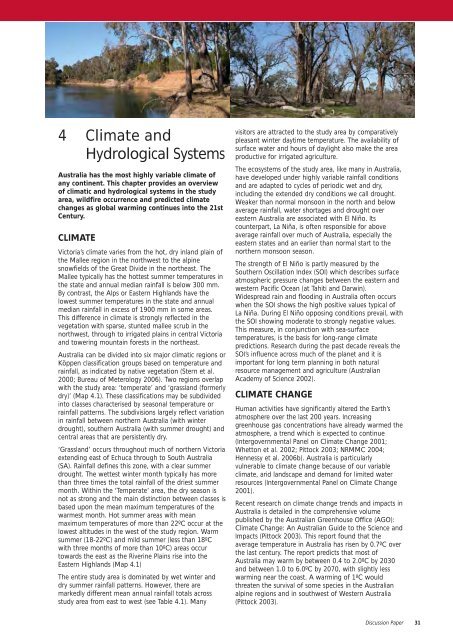
4 Climate andHydrological SystemsAustralia has the most highly variable climate ofany continent. This chapter provides an overviewof climatic and hydrological systems in the studyarea, wildfire occurrence and predicted climatechanges as global warming continues into the 21stCentury.CLIMATEVictoria’s climate varies from the hot, dry inland plain ofthe Mallee region in the northwest to the alpinesnowfields of the Great Divide in the northeast. TheMallee typically has the hottest summer temperatures inthe state and annual median rainfall is below 300 mm.By contrast, the Alps or Eastern Highlands have thelowest summer temperatures in the state and annualmedian rainfall in excess of 1900 mm in some areas.This difference in climate is strongly reflected in thevegetation with sparse, stunted mallee scrub in thenorthwest, through to irrigated plains in central Victoriaand towering mountain forests in the northeast.Australia can be divided into six major climatic regions orKöppen classification groups based on temperature andrainfall, as indicated by native vegetation (Stern et al.2000; Bureau of Meterology 2006). Two regions overlapwith the study area: ‘temperate’ and ‘grassland (formerlydry)’ (Map 4.1). These classifications may be subdividedinto classes characterised by seasonal temperature orrainfall patterns. The subdivisions largely reflect variationin rainfall between northern Australia (with winterdrought), southern Australia (with summer drought) andcentral areas that are persistently dry.‘Grassland’ occurs throughout much of northern Victoriaextending east of Echuca through to South Australia(SA). Rainfall defines this zone, with a clear summerdrought. The wettest winter month typically has morethan three times the total rainfall of the driest summermonth. Within the ‘Temperate’ area, the dry season isnot as strong and the main distinction between classes isbased upon the mean maximum temperatures of thewarmest month. Hot summer areas with meanmaximum temperatures of more than 22ºC occur at thelowest altitudes in the west of the study region. Warmsummer (18-22ºC) and mild summer (less than 18ºCwith three months of more than 10ºC) areas occurtowards the east as the Riverine Plains rise into theEastern Highlands (Map 4.1)The entire study area is dominated by wet winter anddry summer rainfall patterns. However, there aremarkedly different mean annual rainfall totals acrossstudy area from east to west (see Table 4.1). Manyvisitors are attracted to the study area by comparativelypleasant winter daytime temperature. The availability ofsurface water and hours of daylight also make the areaproductive for irrigated agriculture.The ecosystems of the study area, like many in Australia,have developed under highly variable rainfall conditionsand are adapted to cycles of periodic wet and dry,including the extended dry conditions we call drought.Weaker than normal monsoon in the north and belowaverage rainfall, water shortages and drought overeastern Australia are associated with El Niño. Itscounterpart, La Niña, is often responsible for aboveaverage rainfall over much of Australia, especially theeastern states and an earlier than normal start to thenorthern monsoon season.The strength of El Niño is partly measured by theSouthern Oscillation Index (SOI) which describes surfaceatmospheric pressure changes between the eastern andwestern Pacific Ocean (at Tahiti and Darwin).Widespread rain and flooding in Australia often occurswhen the SOI shows the high positive values typical ofLa Niña. During El Niño opposing conditions prevail, withthe SOI showing moderate to strongly negative values.This measure, in conjunction with sea-surfacetemperatures, is the basis for long-range climatepredictions. Research during the past decade reveals theSOI’s influence across much of the planet and it isimportant for long term planning in both naturalresource management and agriculture (AustralianAcademy of Science 2002).CLIMATE CHANGEHuman activities have significantly altered the Earth’satmosphere over the last 200 years. Increasinggreenhouse gas concentrations have already warmed theatmosphere, a trend which is expected to continue(Intergovernmental Panel on Climate Change 2001;Whetton et al. 2002; Pittock 2003; NRMMC 2004;Hennessy et al. 2006b). Australia is particularlyvulnerable to climate change because of our variableclimate, arid landscape and demand for limited waterresources (Intergovernmental Panel on Climate Change2001).Recent research on climate change trends and impacts inAustralia is detailed in the comprehensive volumepublished by the Australian Greenhouse Office (AGO):Climate Change: An Australian Guide to the Science andImpacts (Pittock 2003). This report found that theaverage temperature in Australia has risen by 0.7ºC overthe last century. The report predicts that most ofAustralia may warm by between 0.4 to 2.0ºC by 2030and between 1.0 to 6.0ºC by 2070, with slightly lesswarming near the coast. A warming of 1ºC wouldthreaten the survival of some species in the Australianalpine regions and in southwest of Western Australia(Pittock 2003).<strong>Discussion</strong> <strong>Paper</strong>31