full PDF version (2.1 MB) - Terena
full PDF version (2.1 MB) - Terena
full PDF version (2.1 MB) - Terena
- No tags were found...

Create successful ePaper yourself
Turn your PDF publications into a flip-book with our unique Google optimized e-Paper software.
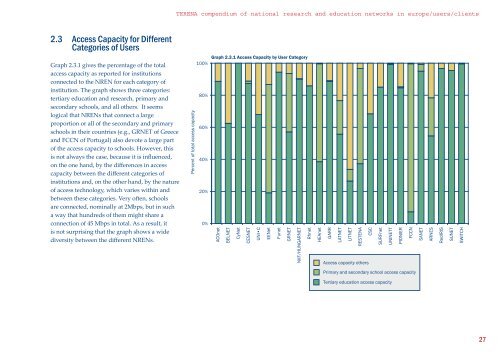
TERENA compendium of national research and education networks in europe/users/clients2.3 Access Capacity for DifferentCategories of UsersGraph 2.3.1 gives the percentage of the totalaccess capacity as reported for institutionsconnected to the NREN for each category ofinstitution. The graph shows three categories:tertiary education and research, primary andsecondary schools, and all others. It seemslogical that NRENs that connect a largeproportion or all of the secondary and primaryschools in their countries (e.g., GRNET of Greeceand FCCN of Portugal) also devote a large partof the access capacity to schools. However, thisis not always the case, because it is influenced,on the one hand, by the differences in accesscapacity between the different categories ofinstitutions and, on the other hand, by the natureof access technology, which varies within andbetween these categories. Very oen, schoolsare connected, nominally at 2Mbps, but in sucha way that hundreds of them might share aconnection of 45 Mbps in total. As a result, itis not surprising that the graph shows a widediversity between the different NRENs.Percent of total access capacityGraph 2.3.1 Access Capacity by User Category100%80%60%40%20%0%ACOnetBELNETCyNetCESNETUNI•CEENetFunetGRNETNIIF/HUNGARNETRhnetHEAnetGARRLATNETLITNETRESTENACSCAccess capacity othersSURFnetUNINETTPIONIERFCCNSANETARNESRedIRISSUNETSWITCHPrimary and secondary school access capacityTertiary education access capacity27