full PDF version (2.1 MB) - Terena
full PDF version (2.1 MB) - Terena
full PDF version (2.1 MB) - Terena
- No tags were found...

You also want an ePaper? Increase the reach of your titles
YUMPU automatically turns print PDFs into web optimized ePapers that Google loves.
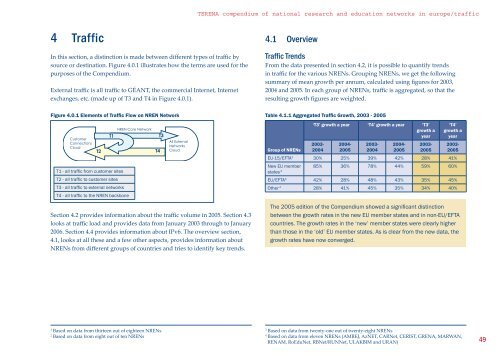
TERENA compendium of national research and education networks in europe/traffic4 TrafficIn this section, a distinction is made between different types of traffic bysource or destination. Figure 4.0.1 illustrates how the terms are used for thepurposes of the Compendium.External traffic is all traffic to GÉANT, the commercial Internet, Internetexchanges, etc. (made up of T3 and T4 in Figure 4.0.1).4.1 OverviewTraffic TrendsFrom the data presented in section 4.2, it is possible to quantify trendsin traffic for the various NRENs. Grouping NRENs, we get the followingsummary of mean growth per annum, calculated using figures for 2003,2004 and 2005. In each group of NRENs, traffic is aggregated, so that theresulting growth figures are weighted.Figure 4.0.1 Elements of Traffic Flow on NREN NetworkCustomerConnectionsCloudT2T1T1 - all traffic from customer sitesT2 - all traffic to customer sitesT3 - all traffic to external networksT4 - all traffic to the NREN backboneNREN Core NetworkT4T3All ExternalNetworksCloudSection 4.2 provides information about the traffic volume in 2005. Section 4.3looks at traffic load and provides data from January 2003 through to January2006. Section 4.4 provides information about IPv6. The overview section,4.1, looks at all these and a few other aspects, provides information aboutNRENs from different groups of countries and tries to identify key trends.Table 4.1.1 Aggregated Traffic Growth, 2003 - 2005‘T3’ growth a year ‘T4’ growth a year ‘T3’growth ayear‘T4’growth ayear2003- 2004- 2003- 2004- 2003- 2003-Group of NRENs 2004 2005 2004 2005 2005 2005EU-15/EFTA 1 30% 25% 39% 42% 28% 41%New EU member 85% 36% 78% 44% 59% 60%states 2EU/EFTA 3 42% 28% 48% 43% 35% 45%Other 4 28% 41% 45% 35% 34% 40%The 2005 edition of the Compendium showed a significant distinctionbetween the growth rates in the new EU member states and in non-EU/EFTAcountries. The growth rates in the ‘new’ member states were clearly higherthan those in the ‘old’ EU member states. As is clear from the new data, thegrowth rates have now converged.1Based on data from thirteen out of eighteen NRENs2Based on data from eight out of ten NRENs3Based on data from twenty-one out of twenty-eight NRENs4Based on data from eleven NRENs (AMREJ, AzNET, CARNet, CERIST, GRENA, MARWAN,RENAM, RoEduNet, RBNet/RUNNet, ULAKBIM and URAN)49