full PDF version (2.1 MB) - Terena
full PDF version (2.1 MB) - Terena
full PDF version (2.1 MB) - Terena
- No tags were found...

Create successful ePaper yourself
Turn your PDF publications into a flip-book with our unique Google optimized e-Paper software.
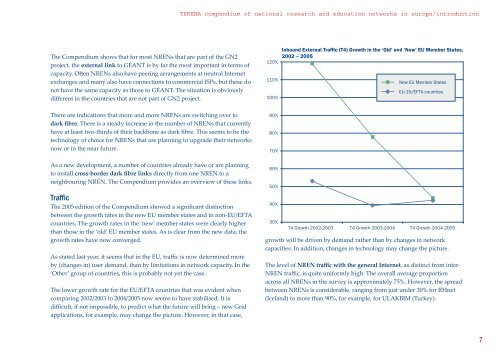
TERENA compendium of national research and education networks in europe/introductionThe Compendium shows that for most NRENs that are part of the GN2project, the external link to GÉANT is by far the most important in terms ofcapacity. Oen NRENs also have peering arrangements at neutral Internetexchanges and many also have connections to commercial ISPs, but these donot have the same capacity as those to GÉANT. The situation is obviouslydifferent in the countries that are not part of GN2 project.120%110%100%Inbound External Traffic (T4) Growth in the ‘Old’ and ‘New’ EU Member States,2002 – 2005New EU Member StatesEU-15/EFTA countriesThere are indications that more and more NRENs are switching over todark fibre. There is a steady increase in the number of NRENs that currentlyhave at least two-thirds of their backbone as dark fibre. This seems to be thetechnology of choice for NRENs that are planning to upgrade their networksnow or in the near future.90%80%70%As a new development, a number of countries already have or are planningto install cross-border dark fibre links directly from one NREN to aneighbouring NREN. The Compendium provides an overview of these links.TrafficThe 2005 edition of the Compendium showed a significant distinctionbetween the growth rates in the new EU member states and in non-EU/EFTAcountries. The growth rates in the ‘new’ member states were clearly higherthan those in the ‘old’ EU member states. As is clear from the new data, thegrowth rates have now converged.As stated last year, it seems that in the EU, traffic is now determined moreby (changes in) user demand, than by limitations in network capacity. In the‘Other’ group of countries, this is probably not yet the case.The lower growth rate for the EU/EFTA countries that was evident whencomparing 2002/2003 to 2004/2005 now seems to have stabilised. It isdifficult, if not impossible, to predict what the future will bring – new Gridapplications, for example, may change the picture. However, in that case,60%50%40%30%T4 Growth 2002-2003 T4 Growth 2003-2004 T4 Growth 2004-2005growth will be driven by demand rather than by changes in networkcapacities. In addition, changes in technology may change the picture.The level of NREN traffic with the general Internet, as distinct from inter-NREN traffic, is quite uniformly high. The overall average proportionacross all NRENs in the survey is approximately 75%. However, the spreadbetween NRENs is considerable, ranging from just under 30% for RHnet(Iceland) to more than 90%, for example, for ULAKBIM (Turkey).7