full PDF version (2.1 MB) - Terena
full PDF version (2.1 MB) - Terena
full PDF version (2.1 MB) - Terena
- No tags were found...

You also want an ePaper? Increase the reach of your titles
YUMPU automatically turns print PDFs into web optimized ePapers that Google loves.
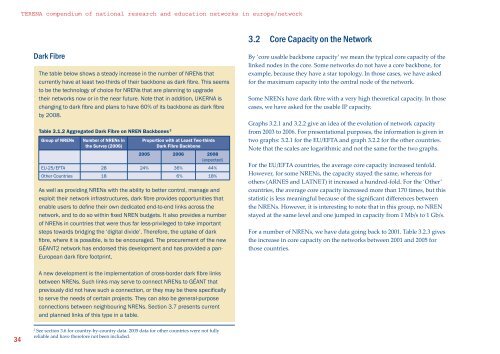
TERENA compendium of national research and education networks in europe/network3.2 Core Capacity on the NetworkDark FibreThe table below shows a steady increase in the number of NRENs thatcurrently have at least two-thirds of their backbone as dark fibre. This seemsto be the technology of choice for NRENs that are planning to upgradetheir networks now or in the near future. Note that in addition, UKERNA ischanging to dark fibre and plans to have 60% of its backbone as dark fibreby 2008.Table 3.1.2 Aggregated Dark Fibre on NREN Backbones 2Group of NRENsNumber of NRENs inthe Survey (2006)Proportion with at Least Two-thirdsDark Fibre Backbone2005 2006 2008(expected)EU-25/EFTA 28 24% 36% 44%Other Countries 18 6% 18%As well as providing NRENs with the ability to better control, manage andexploit their network infrastructures, dark fibre provides opportunities thatenable users to define their own dedicated end-to-end links across thenetwork, and to do so within fixed NREN budgets. It also provides a numberof NRENs in countries that were thus far less-privileged to take importantsteps towards bridging the ‘digital divide’. Therefore, the uptake of darkfibre, where it is possible, is to be encouraged. The procurement of the newGÉANT2 network has endorsed this development and has provided a pan-European dark fibre footprint.By ‘core usable backbone capacity’ we mean the typical core capacity of thelinked nodes in the core. Some networks do not have a core backbone, forexample, because they have a star topology. In those cases, we have askedfor the maximum capacity into the central node of the network.Some NRENs have dark fibre with a very high theoretical capacity. In thosecases, we have asked for the usable IP capacity.Graphs 3.<strong>2.1</strong> and 3.2.2 give an idea of the evolution of network capacityfrom 2003 to 2006. For presentational purposes, the information is given intwo graphs: 3.<strong>2.1</strong> for the EU/EFTA and graph 3.2.2 for the other countries.Note that the scales are logarithmic and not the same for the two graphs.For the EU/EFTA countries, the average core capacity increased tenfold.However, for some NRENs, the capacity stayed the same, whereas forothers (ARNES and LATNET) it increased a hundred-fold. For the ‘Other’countries, the average core capacity increased more than 170 times, but thisstatistic is less meaningful because of the significant differences betweenthe NRENs. However, it is interesting to note that in this group, no NRENstayed at the same level and one jumped in capacity from 1 Mb/s to 1 Gb/s.For a number of NRENs, we have data going back to 2001. Table 3.2.3 givesthe increase in core capacity on the networks between 2001 and 2005 forthose countries.A new development is the implementation of cross-border dark fibre linksbetween NRENs. Such links may serve to connect NRENs to GÉANT thatpreviously did not have such a connection, or they may be there specificallyto serve the needs of certain projects. They can also be general-purposeconnections between neighbouring NRENs. Section 3.7 presents currentand planned links of this type in a table.342See section 3.6 for country-by-country data. 2005 data for other countries were not <strong>full</strong>yreliable and have therefore not been included.