full PDF version (2.1 MB) - Terena
full PDF version (2.1 MB) - Terena
full PDF version (2.1 MB) - Terena
- No tags were found...
You also want an ePaper? Increase the reach of your titles
YUMPU automatically turns print PDFs into web optimized ePapers that Google loves.
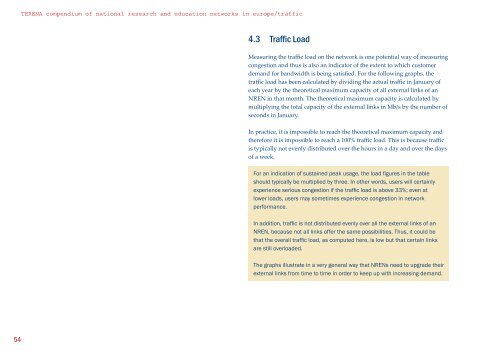
TERENA compendium of national research and education networks in europe/traffic4.3 Traffic LoadMeasuring the traffic load on the network is one potential way of measuringcongestion and thus is also an indicator of the extent to which customerdemand for bandwidth is being satisfied. For the following graphs, thetraffic load has been calculated by dividing the actual traffic in January ofeach year by the theoretical maximum capacity of all external links of anNREN in that month. The theoretical maximum capacity is calculated bymultiplying the total capacity of the external links in Mb/s by the number ofseconds in January.In practice, it is impossible to reach the theoretical maximum capacity andtherefore it is impossible to reach a 100% traffic load. This is because trafficis typically not evenly distributed over the hours in a day and over the daysof a week.For an indication of sustained peak usage, the load figures in the tableshould typically be multiplied by three. In other words, users will certainlyexperience serious congestion if the traffic load is above 33%; even atlower loads, users may sometimes experience congestion in networkperformance.In addition, traffic is not distributed evenly over all the external links of anNREN, because not all links offer the same possibilities. Thus, it could bethat the overall traffic load, as computed here, is low but that certain linksare still overloaded.The graphs illustrate in a very general way that NRENs need to upgrade theirexternal links from time to time in order to keep up with increasing demand.54


