full PDF version (2.1 MB) - Terena
full PDF version (2.1 MB) - Terena
full PDF version (2.1 MB) - Terena
- No tags were found...

Create successful ePaper yourself
Turn your PDF publications into a flip-book with our unique Google optimized e-Paper software.
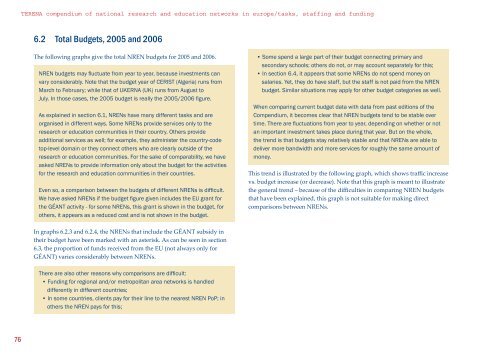
TERENA compendium of national research and education networks in europe/tasks, staffing and funding6.2 Total Budgets, 2005 and 2006The following graphs give the total NREN budgets for 2005 and 2006.NREN budgets may fluctuate from year to year, because investments canvary considerably. Note that the budget year of CERIST (Algeria) runs fromMarch to February; while that of UKERNA (UK) runs from August toJuly. In those cases, the 2005 budget is really the 2005/2006 figure.As explained in section 6.1, NRENs have many different tasks and areorganised in different ways. Some NRENs provide services only to theresearch or education communities in their country. Others provideadditional services as well; for example, they administer the country-codetop-level domain or they connect others who are clearly outside of theresearch or education communities. For the sake of comparability, we haveasked NRENs to provide information only about the budget for the activitiesfor the research and education communities in their countries.Even so, a comparison between the budgets of different NRENs is difficult.We have asked NRENs if the budget figure given includes the EU grant forthe GÉANT activity - for some NRENs, this grant is shown in the budget, forothers, it appears as a reduced cost and is not shown in the budget.• Some spend a large part of their budget connecting primary andsecondary schools; others do not, or may account separately for this;• In section 6.4, it appears that some NRENs do not spend money onsalaries. Yet, they do have staff, but the staff is not paid from the NRENbudget. Similar situations may apply for other budget categories as well.When comparing current budget data with data from past editions of theCompendium, it becomes clear that NREN budgets tend to be stable overtime. There are fluctuations from year to year, depending on whether or notan important investment takes place during that year. But on the whole,the trend is that budgets stay relatively stable and that NRENs are able todeliver more bandwidth and more services for roughly the same amount ofmoney.This trend is illustrated by the following graph, which shows traffic increasevs. budget increase (or decrease). Note that this graph is meant to illustratethe general trend – because of the difficulties in comparing NREN budgetsthat have been explained, this graph is not suitable for making directcomparisons between NRENs.In graphs 6.2.3 and 6.2.4, the NRENs that include the GÉANT subsidy intheir budget have been marked with an asterisk. As can be seen in section6.3, the proportion of funds received from the EU (not always only forGÉANT) varies considerably between NRENs.There are also other reasons why comparisons are difficult:• Funding for regional and/or metropolitan area networks is handleddifferently in different countries;• In some countries, clients pay for their line to the nearest NREN PoP; inothers the NREN pays for this;76