- Page 2 and 3: TiGenix NV(Public limited liability
- Page 4 and 5: Table of ContentsSummary ..........
- Page 7 and 8: 3.7.1 Categories of potential inves
- Page 9 and 10: 5.7.1 Shares and warrants held by i
- Page 11 and 12: 7.5.2 Taxation.....................
- Page 13 and 14: SummaryThe words written in capital
- Page 15 and 16: Activities and strategy of the Comp
- Page 17 and 18: • Two allogeneic adult stem cell
- Page 19 and 20: • TiGenix’ success depends on i
- Page 24 and 25: Recent developmentsAcquisition of C
- Page 26 and 27: In this context, we would like to s
- Page 28 and 29: Announcement of the results of theO
- Page 30 and 31: After the Contribution andafter the
- Page 32 and 33: ContributionContribution AgreementC
- Page 34 and 35: Risk factorsAny investment in the P
- Page 36 and 37: commercialisation of ChondroCelect,
- Page 38 and 39: in delays in bringing products to t
- Page 40 and 41: The Company cannot predict what eff
- Page 42 and 43: y each of its patents and patent ap
- Page 44: to exercise preferential subscripti
- Page 47 and 48: this prospectus which is capable of
- Page 49 and 50: • investment professionals fallin
- Page 51 and 52: 1. General information and informat
- Page 53 and 54: 1.4.2 Company documents and otherin
- Page 55 and 56: • the granting of discharge of li
- Page 57 and 58: • in case of registered Shares, t
- Page 59 and 60: cast at the meeting. If the amount
- Page 61 and 62: No one may cast a greater number of
- Page 63 and 64: If a Belgian resident individual ne
- Page 65 and 66: Belgium has concluded tax treaties
- Page 67 and 68: 3. Information on the Contributiona
- Page 69 and 70: In this context, we would like to s
- Page 71 and 72:
TiGenix has a limited financial deb
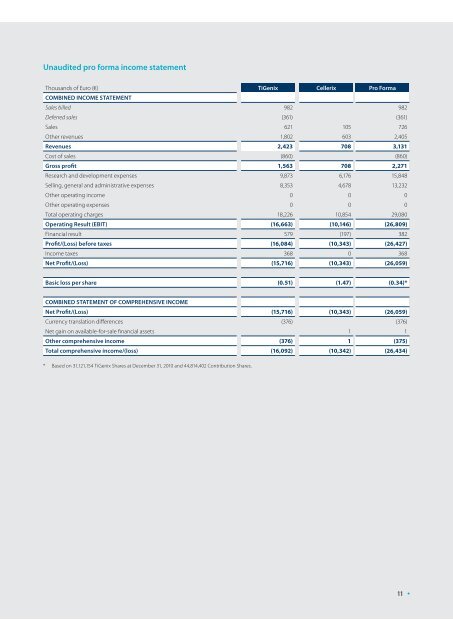
- Page 73 and 74:
Thousands of Euro (€) TiGenix Cel
- Page 75 and 76:
3.5.2 Issuance Price and RatioThe i
- Page 77 and 78:
(c)Rules for subscriptionSubject to
- Page 79 and 80:
The Scrips Private Placement will o
- Page 81 and 82:
to comply with any of its obligatio
- Page 83 and 84:
3.11.2 Scenario 1: Existing Shareho
- Page 85 and 86:
• a pledge of Locked Shares to a
- Page 87 and 88:
4. General information about THECOM
- Page 89 and 90:
DateINCORPORATIONFebruary 21,2000Tr
- Page 91 and 92:
Upon completion of the IPO of TiGen
- Page 93 and 94:
Issue dateMay 14,2004April 20,2005T
- Page 95 and 96:
4.7.2 Voting rightsAs further descr
- Page 97 and 98:
can be obtained free of charge at t
- Page 99 and 100:
5.2.4 Composition of the Board of D
- Page 101 and 102:
Amonis. Mr. Duron has been CEO of K
- Page 103 and 104:
5.3.4 Nomination and remunerationco
- Page 105 and 106:
• investor relations: nurturing c
- Page 107 and 108:
The remuneration of the members of
- Page 109 and 110:
5.7.2 Shares and warrants held by e
- Page 111 and 112:
Cellerix EBIP 2010An EBIP for senio
- Page 113 and 114:
The minutes must also contain a jus
- Page 115 and 116:
6. Activities of Tigenix andits sub
- Page 117 and 118:
• Clinical stage pipeline. TiGeni
- Page 119 and 120:
6.3.3 Acquisition of CellerixAs a r
- Page 121 and 122:
Full thickness articular cartilage
- Page 123 and 124:
Fig. 6.2: Autologous Chondrocyte Im
- Page 125 and 126:
Preclinical work in a meniscus repa
- Page 127 and 128:
The Company is also ensuring high q
- Page 129 and 130:
Recognising the importance of pre-l
- Page 131 and 132:
In Spain, since the passage of Orde
- Page 133 and 134:
Fig. 6.6: ChondroMimetic procedure
- Page 135 and 136:
6.5.3 Commercial strategyBuilding o
- Page 137 and 138:
6.7 Manufacturing & logisticsEffici
- Page 139 and 140:
The international application WO06/
- Page 141 and 142:
ChondroMimetic competitionThe main
- Page 143 and 144:
in Cellerix’ GMP facility in Madr
- Page 145 and 146:
6.14.3 History and development of C
- Page 147 and 148:
The table below gives an overview o
- Page 149 and 150:
Prevalence No. of cases (2010) Esti
- Page 151 and 152:
Fig. 6.9: Platform development stra
- Page 153 and 154:
In developing Cx601, Cellerix has b
- Page 155 and 156:
6.14.6 Manufacturing & logisticsCel
- Page 157 and 158:
population, methods for the isolati
- Page 159 and 160:
• Cimzia (certolizumab) - UCB: Al
- Page 161 and 162:
Spanish Ministry of Education and S
- Page 163 and 164:
7.2 Consolidated income statementTw
- Page 165 and 166:
7.3.1.2 Research and development ex
- Page 167 and 168:
7.3.2.3 Selling, general and admini
- Page 169 and 170:
7.4.1 Cash flows from operating act
- Page 171 and 172:
Cash & cash equivalents and intangi
- Page 173 and 174:
As of December 31, 2010, the Group
- Page 175 and 176:
8. Consolidated Financial informati
- Page 177 and 178:
8.1.3 Consolidated cash flow statem
- Page 179 and 180:
8.1.5 Notes to consolidated financi
- Page 181 and 182:
operating results and operating pla
- Page 183 and 184:
The Group does not account for work
- Page 186 and 187:
8.1.5.4 Operating result (EBIT)Resu
- Page 188 and 189:
8.1.5.7 TaxesThere is no current ta
- Page 190 and 191:
8.1.5.10 Tangible assetsThousands o
- Page 192 and 193:
8.1.5.14 Deferred charges & accrued
- Page 194 and 195:
8.1.5.18 Finance lease obligations
- Page 196 and 197:
Business combination Cellerix SADes
- Page 198 and 199:
Weighted averageexercise priceTOTAL
- Page 200 and 201:
the respective issue date of the wa
- Page 202 and 203:
Transactions with non-executive dir
- Page 204 and 205:
8.1.5.28 Subsequent eventsAcquisiti
- Page 206 and 207:
8.1.5.31 Disclosure under Article 1
- Page 208 and 209:
Additional statementsThe preparatio
- Page 210 and 211:
9.1.2 Stand-alone balance sheetYear
- Page 212 and 213:
9.1.4 Stand-alone statement of chan
- Page 214 and 215:
) Standards and interpretations iss
- Page 216 and 217:
The clinical development of new dru
- Page 218 and 219:
future against which they may be ap
- Page 220 and 221:
Cellerix’ research and developmen
- Page 222 and 223:
YearThousandsof Euro2010 2009 2008E
- Page 224 and 225:
Thousands of Euro (€)Laboratoryeq
- Page 226 and 227:
Current financial assetsShown below
- Page 228 and 229:
At December 31, Cellerix’ share c
- Page 230 and 231:
9.1.5.17 Deferred revenueThe balanc
- Page 232 and 233:
9.1.5.21 Share-based paymentsThe EB
- Page 234 and 235:
GrantsCellerix received several gra
- Page 236 and 237:
10. Report regarding unaudited prof
- Page 238 and 239:
EMAFDAFibrous tissueGCPGMPGrowth fa
- Page 240 and 241:
Appendix 1: Press releases 2006-201
- Page 242 and 243:
Appendix 2: REGULATORY APPROVALPROC
- Page 244 and 245:
like ChondroCelect or the future ce
- Page 246 and 247:
TitleCountry/regionPatent/applicati
- Page 248 and 249:
TitleCountry/regionPatent/applicati
- Page 250 and 251:
Title“Cell populations having imu
- Page 252 and 253:
D. Trademarks of CellerixThe table
- Page 254 and 255:
Decision resources.Dell’Accio, F.
- Page 256 and 257:
Noyes, F. R., Barber-Westin, S. D.,
- Page 258 and 259:
Appendix 5: 2008, 2009 and2010 mana
- Page 260 and 261:
Contents1. The year in brief ......
- Page 262 and 263:
2. Financial informationa. The Inco
- Page 264 and 265:
The Directors shall call a Sharehol
- Page 266 and 267:
• Exercise price changed to 5.291
- Page 268 and 269:
10 • TiGenix • Rights Offering
- Page 270 and 271:
Contents1. The year in brief ......
- Page 272 and 273:
3. Financial informationa. The Inco
- Page 274 and 275:
Exceptionally, for the following re
- Page 276 and 277:
(d)(e)Duration: The Options Plan wi
- Page 278 and 279:
Contents1. The year in brief ......
- Page 280 and 281:
3. Financial informationa. The Inco
- Page 282 and 283:
eceipt sent to the number or addres
- Page 284 and 285:
THE COMPANYTiGenix NVRomeinse straa