to download PDF version - Toyota
to download PDF version - Toyota
to download PDF version - Toyota

Create successful ePaper yourself
Turn your PDF publications into a flip-book with our unique Google optimized e-Paper software.
Full-time employees enjoy a 13 th cheque<br />
bonus, Masibambane agreement bonus (paid<br />
on achievement of a certain production or sales<br />
related activity), provident fund and medical aid.<br />
TSAM has introduced a defined contribution<br />
scheme for all new employees that join the<br />
company. This scheme pays a contribution <strong>to</strong><br />
an individual’s account every month, which is<br />
then invested, the returns of which are credited<br />
<strong>to</strong> the individual’s account. Existing employees<br />
can choose <strong>to</strong> switch <strong>to</strong> this scheme, or remain<br />
on the old defined benefit pension scheme,<br />
which pays out a fixed amount <strong>to</strong> the retiree<br />
every month according <strong>to</strong> the numbers of years<br />
worked and salary at retirement.<br />
Recruitment<br />
Formal recruitment processes are in place for internal<br />
appointments, external appointments and temporary<br />
staff. These procedures have timeframes and<br />
turnaround times, all of which are linked <strong>to</strong> defined<br />
tasks, communication routes and requirements.<br />
Performance management<br />
TSAM has rolled out a performance management<br />
process over the last three years. The<br />
process started in FY08 with salaried employees<br />
in Bands 10-11 and upward receiving performance<br />
and career development reviews.<br />
Reviews were introduced <strong>to</strong> Bands 8-9 and upward<br />
in FY09, hence the percentage of employees<br />
receiving reviews doubled between FY08<br />
and FY09. Reviews will be extended <strong>to</strong> Bands<br />
5-7 in FY10. The goal is for 100% of salaried<br />
employees <strong>to</strong> receive performance and career<br />
development reviews in FY10 and beyond.<br />
Percentage of salaried employees receiving regular<br />
performance and career development reviews<br />
FY08 FY09<br />
34.5% 70.8%<br />
Table 21<br />
Overtime<br />
Benefits Permanent<br />
employee<br />
(salaried)<br />
Stipulated work hours per week and average hours worked overtime in production<br />
Overtime hours worked<br />
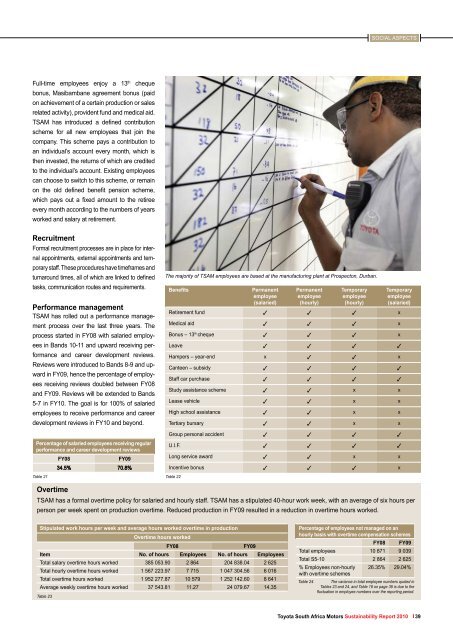
The majority of TSAM employees are based at the manufacturing plant at Prospec<strong>to</strong>n, Durban.<br />
Permanent<br />
employee<br />
(hourly)<br />
Temporary<br />
employee<br />
(hourly)<br />
SOCIAL ASPECTS<br />
Temporary<br />
employee<br />
(salaried)<br />
Retirement fund ✓ ✓ ✓ x<br />
Medical aid ✓ ✓ ✓ x<br />
Bonus – 13 th cheque ✓ ✓ ✓ x<br />
Leave ✓ ✓ ✓ ✓<br />
Hampers – year-end x ✓ ✓ x<br />
Canteen – subsidy ✓ ✓ ✓ ✓<br />
Staff car purchase ✓ ✓ ✓ ✓<br />
Study assistance scheme ✓ ✓ x x<br />
Lease vehicle ✓ ✓ x x<br />
High school assistance ✓ ✓ x x<br />
Tertiary bursary ✓ ✓ x x<br />
Group personal accident ✓ ✓ ✓ ✓<br />
U.I.F. ✓ ✓ ✓ ✓<br />
Long service award ✓ ✓ x x<br />
Incentive bonus ✓ ✓ ✓ x<br />
TSAM has a formal overtime policy for salaried and hourly staff. TSAM has a stipulated 40-hour work week, with an average of six hours per<br />
person per week spent on production overtime. Reduced production in FY09 resulted in a reduction in overtime hours worked.<br />
FY08 FY09<br />
Item No. of hours Employees No. of hours Employees<br />
Total salary overtime hours worked 385 053.90 2 864 204 838.04 2 625<br />
Total hourly overtime hours worked 1 567 223.97 7 715 1 047 304.56 6 016<br />
Total overtime hours worked 1 952 277.87 10 579 1 252 142.60 8 641<br />
Average weekly overtime hours worked 37 543.81 11.27 24 079.67 14.35<br />
Table 23<br />
Table 22<br />
Percentage of employees not managed on an<br />
hourly basis with overtime compensation schemes<br />
FY08 FY09<br />
Total employees 10 871 9 039<br />
Total S5-10 2 864 2 625<br />
% Employees non-hourly<br />
with overtime schemes<br />
26.35% 29.04%<br />
Table 24 The variance in <strong>to</strong>tal employee numbers quoted in<br />
Tables 23 and 24, and Table 18 on page 38 is due <strong>to</strong> the<br />
fluctuation in employee numbers over the reporting period.<br />
<strong>Toyota</strong> South Africa Mo<strong>to</strong>rs Sustainability Report 2010 39