to download PDF version - Toyota
to download PDF version - Toyota
to download PDF version - Toyota

Create successful ePaper yourself
Turn your PDF publications into a flip-book with our unique Google optimized e-Paper software.
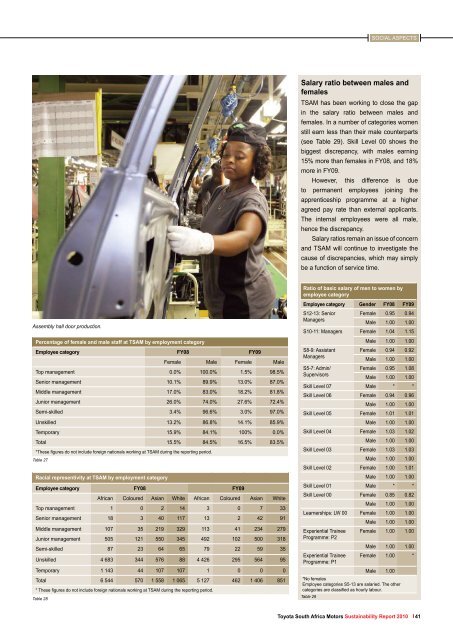
Assembly hall door production.<br />
Percentage of female and male staff at TSAM by employment category<br />
Employee category FY08 FY09<br />
Female Male Female Male<br />
Top management 0.0% 100.0% 1.5% 98.5%<br />
Senior management 10.1% 89.9% 13.0% 87.0%<br />
Middle management 17.0% 83.0% 18.2% 81.8%<br />
Junior management 26.0% 74.0% 27.6% 72.4%<br />
Semi-skilled 3.4% 96.6% 3.0% 97.0%<br />
Unskilled 13.2% 86.8% 14.1% 85.9%<br />
Temporary 15.9% 84.1% 100% 0.0%<br />
Total 15.5% 84.5% 16.5% 83.5%<br />
*These figures do not include foreign nationals working at TSAM during the reporting period.<br />
Table 27<br />
Racial representivity at TSAM by employment category<br />
Employee category FY08 FY09<br />
African Coloured Asian White African Coloured Asian White<br />
Top management 1 0 2 14 3 0 7 33<br />
Senior management 18 3 40 117 13 2 42 91<br />
Middle management 107 35 219 329 113 41 234 279<br />
Junior management 505 121 550 345 492 102 500 318<br />
Semi-skilled 87 23 64 65 79 22 59 35<br />
Unskilled 4 683 344 576 88 4 426 295 564 95<br />
Temporary 1 143 44 107 107 1 0 0 0<br />
Total 6 544 570 1 558 1 065 5 127 462 1 406 851<br />
* These figures do not include foreign nationals working at TSAM during the reporting period.<br />
Table 28<br />
SOCIAL ASPECTS<br />
Salary ratio between males and<br />
females<br />
TSAM has been working <strong>to</strong> close the gap<br />
in the salary ratio between males and<br />
females. In a number of categories women<br />
still earn less than their male counterparts<br />
(see Table 29). Skill Level 00 shows the<br />
biggest discrepancy, with males earning<br />
15% more than females in FY08, and 18%<br />
more in FY09.<br />
However, this difference is due<br />
<strong>to</strong> permanent employees joining the<br />
apprenticeship programme at a higher<br />
agreed pay rate than external applicants.<br />
The internal employees were all male,<br />
hence the discrepancy.<br />
Salary ratios remain an issue of concern<br />
and TSAM will continue <strong>to</strong> investigate the<br />
cause of discrepancies, which may simply<br />
be a function of service time.<br />
Ratio of basic salary of men <strong>to</strong> women by<br />
employee category<br />
Employee category Gender FY08 FY09<br />
S12-13: Senior<br />
Female 0.95 0.94<br />
Managers<br />
Male 1.00 1.00<br />
S10-11: Managers Female 1.04 1.15<br />
Male 1.00 1.00<br />
S8-9: Assistant<br />
Female 0.94 0.92<br />
Managers<br />
Male 1.00 1.00<br />
S5-7: Admin/<br />
Female 0.95 1.08<br />
Supervisors<br />
Male 1.00 1.00<br />
Skill Level 07 Male * *<br />
Skill Level 06 Female 0.94 0.96<br />
Male 1.00 1.00<br />
Skill Level 05 Female 1.01 1.01<br />
Male 1.00 1.00<br />
Skill Level 04 Female 1.03 1.02<br />
Male 1.00 1.00<br />
Skill Level 03 Female 1.03 1.03<br />
Male 1.00 1.00<br />
Skill Level 02 Female 1.00 1.01<br />
Male 1.00 1.00<br />
Skill Level 01 Male * *<br />
Skill Level 00 Female 0.85 0.82<br />
Male 1.00 1.00<br />
Learnerships: LW 00 Female 1.00 1.00<br />
Male 1.00 1.00<br />
Experiential Trainee<br />
Programme: P2<br />
Female 1.00 1.00<br />
Male 1.00 1.00<br />
Experiential Trainee<br />
Programme: P1<br />
Female 1.00 *<br />
*No females<br />
Male 1.00<br />
Employee categories S5-13 are salaried. The other<br />
categories are classified as hourly labour.<br />
Table 29<br />
<strong>Toyota</strong> South Africa Mo<strong>to</strong>rs Sustainability Report 2010 41