Annual report 2009 - Dexia.com
Annual report 2009 - Dexia.com
Annual report 2009 - Dexia.com
- No tags were found...

You also want an ePaper? Increase the reach of your titles
YUMPU automatically turns print PDFs into web optimized ePapers that Google loves.
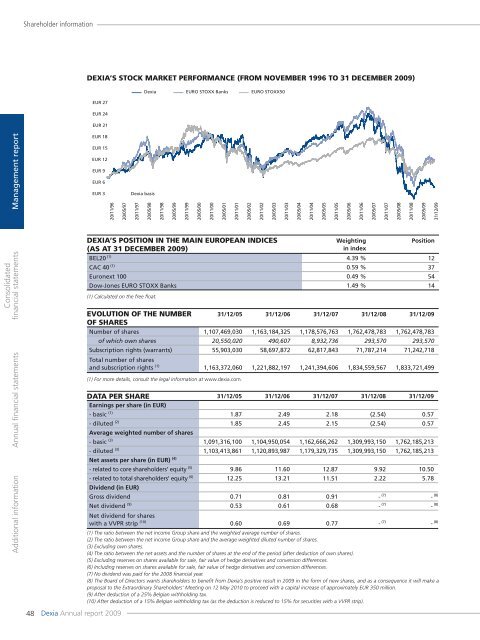
Shareholder informationDEXIA’S STOCK MARKET PERFORMANCE (FROM NOVEMBER 1996 TO 31 DECEMBER <strong>2009</strong>)<strong>Dexia</strong>EURO STOXX BanksEURO STOXX50EUR 27EUR 24EUR 21Management <strong>report</strong>EUR 18EUR 15EUR 12EUR 9EUR 6EUR 320/11/96<strong>Dexia</strong> basis20/05/9720/11/9720/05/9820/11/9820/05/9920/11/9920/05/0020/11/0020/05/0120/11/0120/05/0220/11/0220/05/0320/11/0320/05/0420/11/0420/05/0520/11/0520/05/0620/11/0620/05/0720/11/0720/05/0820/11/0820/05/0931/12/09Consolidatedfinancial statements<strong>Annual</strong> financial statementsAdditional information48<strong>Dexia</strong> <strong>Annual</strong> <strong>report</strong> <strong>2009</strong>DEXIA’S POSITION IN THE MAIN EUROPEAN INDICESWeightingPosition(AS AT 31 DECEMBER <strong>2009</strong>)in indexBEL20 (1) 4.39 % 12CAC 40 (1) 0.59 % 37Euronext 100 0.49 % 54Dow-Jones EURO STOXX Banks 1.49 % 14(1) Calculated on the free float.EVOLUTION OF THE NUMBER 31/12/05 31/12/06 31/12/07 31/12/08 31/12/09OF SHARESNumber of shares 1,107,469,030 1,163,184,325 1,178,576,763 1,762,478,783 1,762,478,783of which own shares 20,550,020 490,607 8,932,736 293,570 293,570Subscription rights (warrants) 55,903,030 58,697,872 62,817,843 71,787,214 71,242,718Total number of sharesand subscription rights (1) 1,163,372,060 1,221,882,197 1,241,394,606 1,834,559,567 1,833,721,499(1) For more details, consult the legal information at www.dexia.<strong>com</strong>.DATA PER SHARE 31/12/05 31/12/06 31/12/07 31/12/08 31/12/09Earnings per share (in EUR)- basic (1) 1.87 2.49 2.18 (2.54) 0.57- diluted (2) 1.85 2.45 2.15 (2.54) 0.57Average weighted number of shares- basic (3) 1,091,316,100 1,104,950,054 1,162,666,262 1,309,993,150 1,762,185,213- diluted (3) 1,103,413,861 1,120,893,987 1,179,329,735 1,309,993,150 1,762,185,213Net assets per share (in EUR) (4)- related to core shareholders’ equity (5) 9.86 11.60 12.87 9.92 10.50- related to total shareholders’ equity (6) 12.25 13.21 11.51 2.22 5.78Dividend (in EUR)Gross dividend 0.71 0.81 0.91 - (7) - (8)Net dividend (9) 0.53 0.61 0.68 - (7) - (8)Net dividend for shareswith a VVPR strip (10) 0.60 0.69 0.77 - (7) - (8)(1) The ratio between the net in<strong>com</strong>e Group share and the weighted average number of shares.(2) The ratio between the net in<strong>com</strong>e Group share and the average weighted diluted number of shares.(3) Excluding own shares.(4) The ratio between the net assets and the number of shares at the end of the period (after deduction of own shares).(5) Excluding reserves on shares available for sale, fair value of hedge derivatives and conversion differences.(6) Including reserves on shares available for sale, fair value of hedge derivatives and conversion differences.(7) No dividend was paid for the 2008 financial year.(8) The Board of Directors wants shareholders to benefit from <strong>Dexia</strong>’s positive result in <strong>2009</strong> in the form of new shares, and as a consequence it will make aproposal to the Extraordinary Shareholders’ Meeting on 12 May 2010 to proceed with a capital increase of approximately EUR 350 million.(9) After deduction of a 25% Belgian withholding tax.(10) After deduction of a 15% Belgian withholding tax (as the deduction is reduced to 15% for securities with a VVPR strip).