Analyst Software Reference Guide - AB Sciex
Analyst Software Reference Guide - AB Sciex
Analyst Software Reference Guide - AB Sciex
- No tags were found...
You also want an ePaper? Increase the reach of your titles
YUMPU automatically turns print PDFs into web optimized ePapers that Google loves.
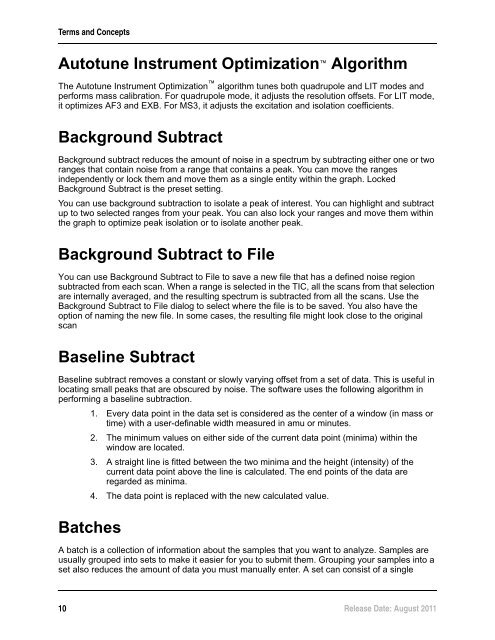
Terms and ConceptsAutotune Instrument Optimization AlgorithmThe Autotune Instrument Optimization algorithm tunes both quadrupole and LIT modes andperforms mass calibration. For quadrupole mode, it adjusts the resolution offsets. For LIT mode,it optimizes AF3 and EXB. For MS3, it adjusts the excitation and isolation coefficients.Background SubtractBackground subtract reduces the amount of noise in a spectrum by subtracting either one or tworanges that contain noise from a range that contains a peak. You can move the rangesindependently or lock them and move them as a single entity within the graph. LockedBackground Subtract is the preset setting.You can use background subtraction to isolate a peak of interest. You can highlight and subtractup to two selected ranges from your peak. You can also lock your ranges and move them withinthe graph to optimize peak isolation or to isolate another peak.Background Subtract to FileYou can use Background Subtract to File to save a new file that has a defined noise regionsubtracted from each scan. When a range is selected in the TIC, all the scans from that selectionare internally averaged, and the resulting spectrum is subtracted from all the scans. Use theBackground Subtract to File dialog to select where the file is to be saved. You also have theoption of naming the new file. In some cases, the resulting file might look close to the originalscanBaseline SubtractBaseline subtract removes a constant or slowly varying offset from a set of data. This is useful inlocating small peaks that are obscured by noise. The software uses the following algorithm inperforming a baseline subtraction.1. Every data point in the data set is considered as the center of a window (in mass ortime) with a user-definable width measured in amu or minutes.2. The minimum values on either side of the current data point (minima) within thewindow are located.3. A straight line is fitted between the two minima and the height (intensity) of thecurrent data point above the line is calculated. The end points of the data areregarded as minima.4. The data point is replaced with the new calculated value.BatchesA batch is a collection of information about the samples that you want to analyze. Samples areusually grouped into sets to make it easier for you to submit them. Grouping your samples into aset also reduces the amount of data you must manually enter. A set can consist of a single10 Release Date: August 2011


