Analyst Software Reference Guide - AB Sciex
Analyst Software Reference Guide - AB Sciex
Analyst Software Reference Guide - AB Sciex
- No tags were found...

Create successful ePaper yourself
Turn your PDF publications into a flip-book with our unique Google optimized e-Paper software.
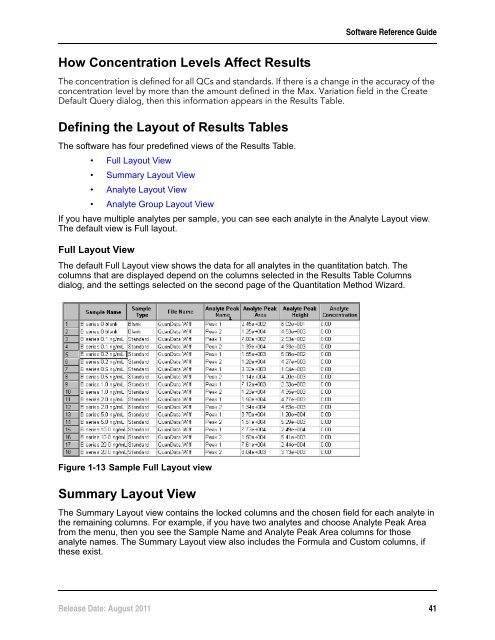
<strong>Software</strong> <strong>Reference</strong> <strong>Guide</strong>How Concentration Levels Affect ResultsThe concentration is defined for all QCs and standards. If there is a change in the accuracy of theconcentration level by more than the amount defined in the Max. Variation field in the CreateDefault Query dialog, then this information appears in the Results Table.Defining the Layout of Results TablesThe software has four predefined views of the Results Table.• Full Layout View• Summary Layout View• Analyte Layout View• Analyte Group Layout ViewIf you have multiple analytes per sample, you can see each analyte in the Analyte Layout view.The default view is Full layout.Full Layout ViewThe default Full Layout view shows the data for all analytes in the quantitation batch. Thecolumns that are displayed depend on the columns selected in the Results Table Columnsdialog, and the settings selected on the second page of the Quantitation Method Wizard.Figure 1-13 Sample Full Layout viewSummary Layout ViewThe Summary Layout view contains the locked columns and the chosen field for each analyte inthe remaining columns. For example, if you have two analytes and choose Analyte Peak Areafrom the menu, then you see the Sample Name and Analyte Peak Area columns for thoseanalyte names. The Summary Layout view also includes the Formula and Custom columns, ifthese exist.Release Date: August 2011 41