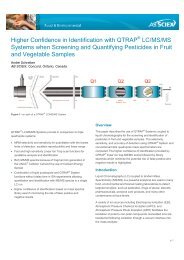
Analyst Software Reference Guide - AB Sciex
Analyst Software Reference Guide - AB Sciex
Analyst Software Reference Guide - AB Sciex
- No tags were found...

You also want an ePaper? Increase the reach of your titles
YUMPU automatically turns print PDFs into web optimized ePapers that Google loves.
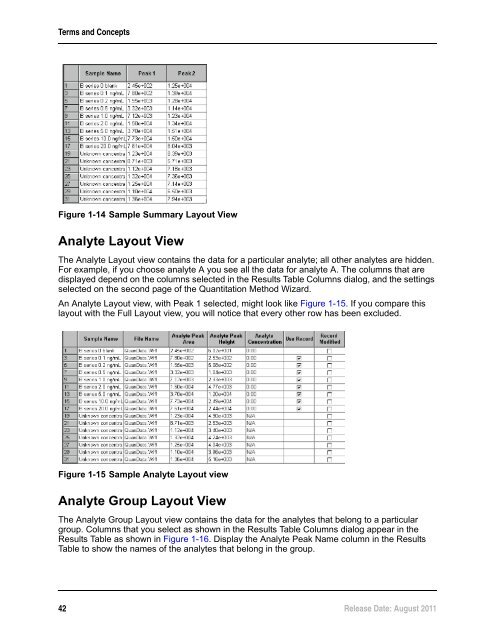
Terms and ConceptsFigure 1-14 Sample Summary Layout ViewAnalyte Layout ViewThe Analyte Layout view contains the data for a particular analyte; all other analytes are hidden.For example, if you choose analyte A you see all the data for analyte A. The columns that aredisplayed depend on the columns selected in the Results Table Columns dialog, and the settingsselected on the second page of the Quantitation Method Wizard.An Analyte Layout view, with Peak 1 selected, might look like Figure 1-15. If you compare thislayout with the Full Layout view, you will notice that every other row has been excluded.Figure 1-15 Sample Analyte Layout viewAnalyte Group Layout ViewThe Analyte Group Layout view contains the data for the analytes that belong to a particulargroup. Columns that you select as shown in the Results Table Columns dialog appear in theResults Table as shown in Figure 1-16. Display the Analyte Peak Name column in the ResultsTable to show the names of the analytes that belong in the group.42 Release Date: August 2011